Over the long run, T-bill vs bond returns are not close: cash was the worst place to be, compounding about 2.75% a year since 1991 while U.S. bonds did far better. But from 2020 to 2026, cash genuinely did beat high-grade bonds for the first time in a generation, before quietly losing to inflation anyway.
There is now a record $7.97 trillion sitting in U.S. money market funds (Investment Company Institute, September 2026), and a lot of it is there because holders looked at the last few years and asked a fair question: why own bonds at all? Three-month Treasury bills still pay around 4%, the ride is smooth, and in 2022 bonds fell almost as hard as stocks. So we ran the numbers. Below is what a dollar actually did in cash versus bonds over 35 years, and over the recent stretch that started the whole “T-bill and chill” conversation.
A T-bill (Treasury bill) is a short-term U.S. government IOU, usually three months to a year, that pays no coupon and is treated as the closest thing to risk-free cash. A money market fund just rolls a basket of these and similar instruments, which is how everyday investors hold “cash” at a yield. “T-bill and chill” is the idea that with bills paying about 4%, you can skip bonds and stocks and collect a safe yield while you wait.
To test it, we compared a rolling T-bill (cash) strategy against the main ways people own bonds: short Treasuries, the broad US Aggregate (the standard investment-grade bond benchmark, roughly a quarter corporate credit and the rest government and mortgage bonds), investment-grade corporates, and high-yield (“junk”) bonds. We added a classic 60/40 portfolio (60% stocks, 40% bonds) and the S&P 500 for context. Every figure below is a total return (price change plus reinvested income), monthly, from January 1991 to August 2026.
Stretch the window to a full 35 years and the verdict is blunt. Cash was the worst asset on the board. A $100 bill-rolling strategy grew to about $263. The same $100 in the US Aggregate grew to $534, in investment-grade corporates to $618, and in high-yield bonds to more than $1,600. Every kind of bond, from the safest to the riskiest, beat cash, and the pattern is clean: the more credit and interest-rate risk you took, the more you earned.
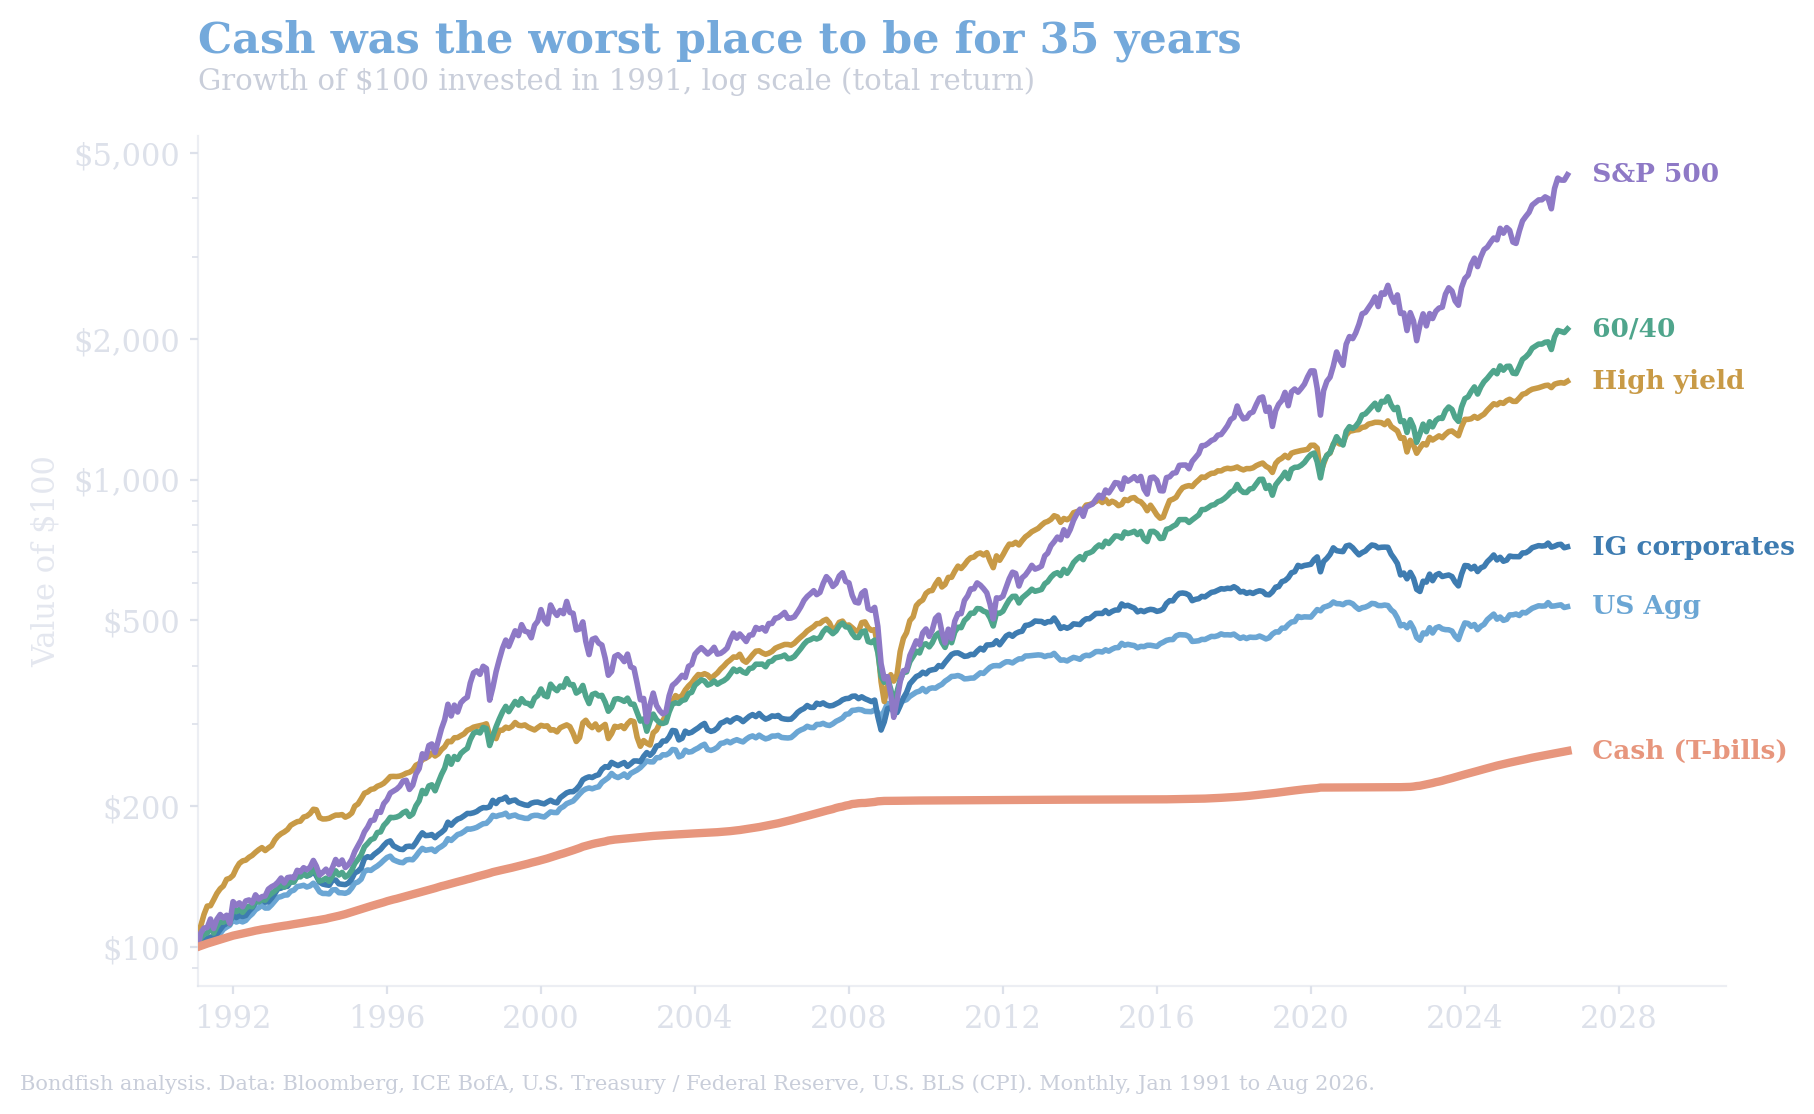 Growth of $100, 1991 to 2026, total return (log scale). Cash is the lowest line by a wide margin. Source: Bondfish analysis; Bloomberg, ICE BofA, U.S. Treasury / Federal Reserve, U.S. BLS.
In annual terms, cash compounded at 2.75% a year against 4.82% for the US Aggregate and 8.15% for high yield. Cash beat the US Aggregate in only 11 of the last 35 calendar years. It is a fine place to park money you need next year, and a reliable way to fall behind over a decade. If your goal is simply to keep interest-rate risk low without sitting entirely in cash, short-duration bond funds have historically split the difference.
| Strategy | Return / yr | After inflation | Worst drawdown | $100 became |
|---|---|---|---|---|
| Cash (T-bills) | 2.75% | 0.15% | 0% | $263 |
| Short bonds (2Y) | 3.27% | 0.66% | -6% | $315 |
| US Aggregate | 4.82% | 2.17% | -17% | $534 |
| IG corporates | 5.70% | 3.02% | -20% | $618 |
| High yield | 8.15% | 5.41% | -33% | $1,623 |
| 60/40 portfolio | 8.93% | 6.18% | -33% | $2,100 |
| S&P 500 | 11.28% | 8.47% | -51% | $4,489 |
The meme is not made up. It was born in a single, brutal year. In 2022 the Federal Reserve raised rates at the fastest pace in four decades, and because a bond’s price falls when yields rise, longer bonds were hit hard. The key idea here is duration, a bond’s sensitivity to rate moves: the longer the duration, the bigger the loss when rates jump. The US Aggregate lost 13% that year, investment-grade corporates lost nearly 16%, and even a 60/40 fell 16% as stocks dropped too. Cash, with essentially zero duration, was the only thing that finished the year up.
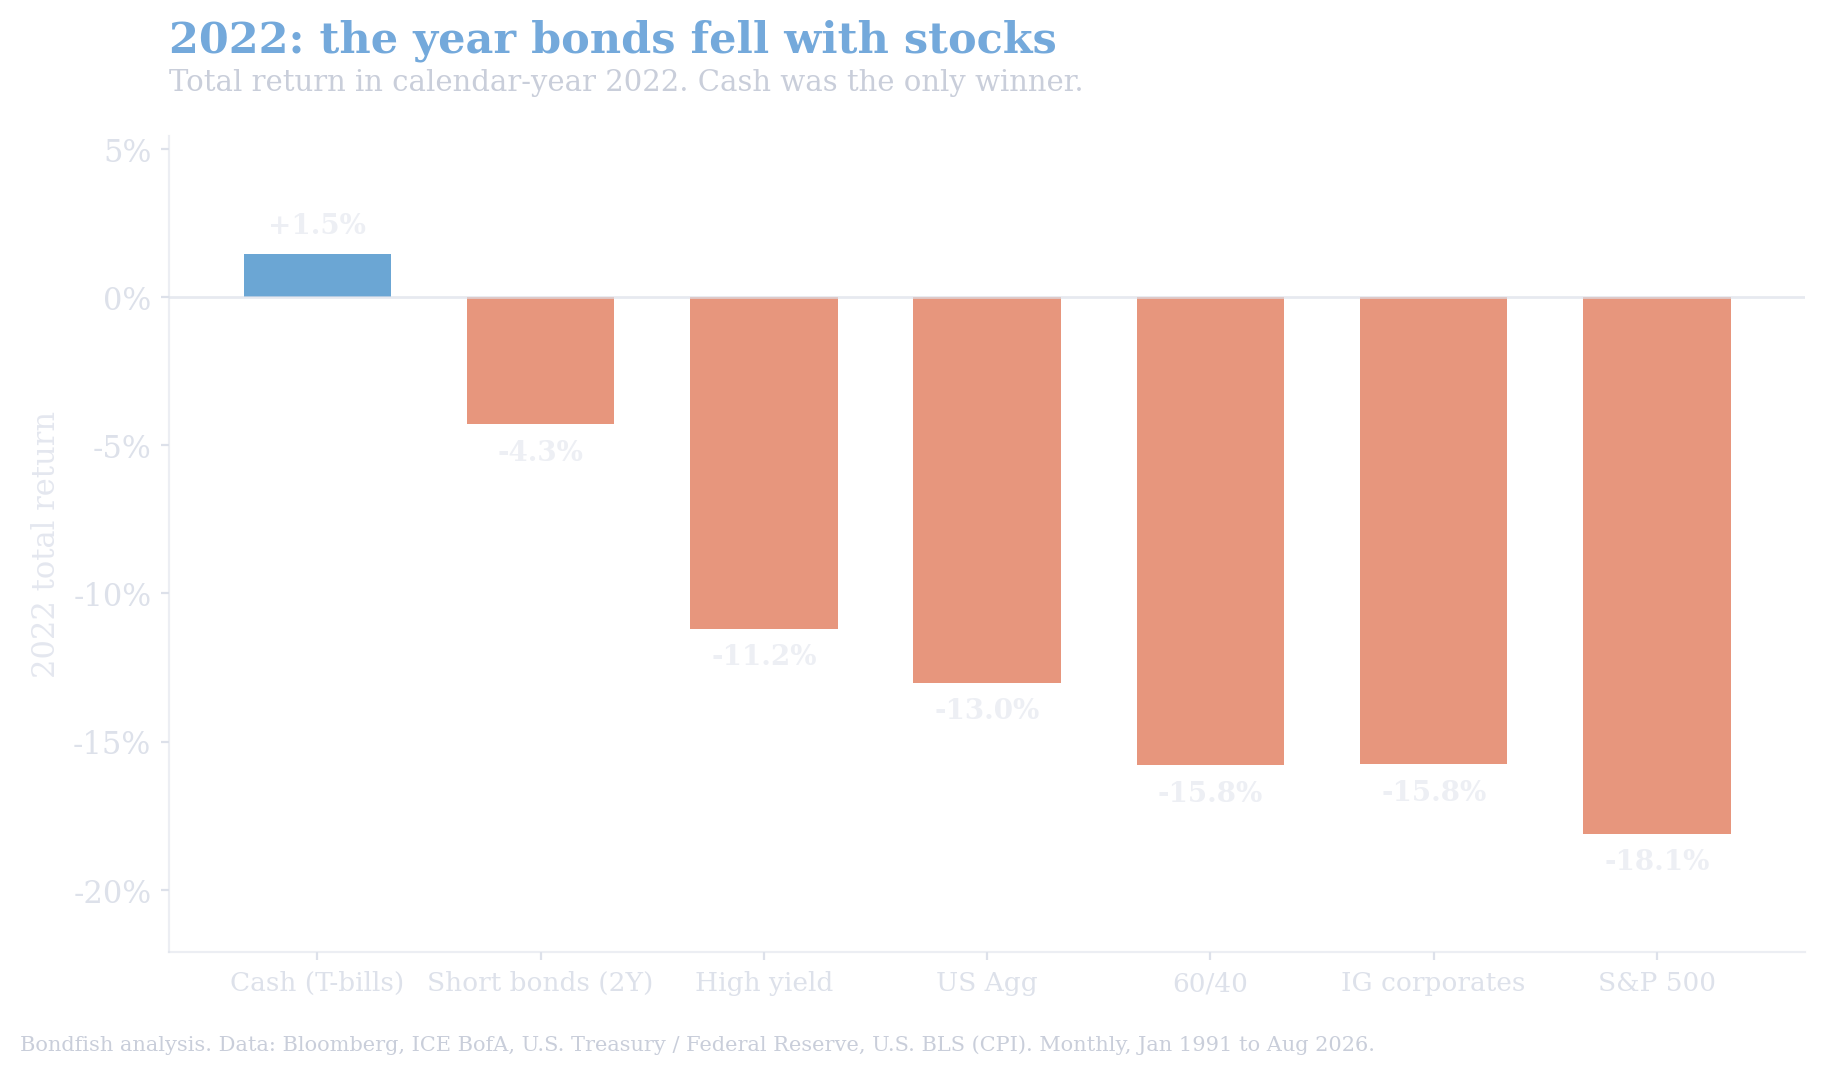 Calendar-year 2022 total return. Cash was the only winner in the year that started the “T-bill and chill” trade. Source: Bondfish analysis; Bloomberg, ICE BofA.
When stocks and bonds fall together, the usual reason to own bonds (they zig when stocks zag) disappears for a while, and cash looks brilliant. That is exactly what happened, and it is why so many investors concluded bonds were broken.
Zoom into the window that actually drives the debate, end-2019 to today, and cash really did win against high-grade bonds. Cash returned 2.83% a year. Short bonds did 2.03%, the US Aggregate just 0.77%, and long Treasuries actually lost money at -0.67% a year. Turned into dollars, $100 in cash became about $120 while the same $100 in the US Aggregate reached only $105 and long Treasuries sat below $100, still underwater from the 2022 crash.
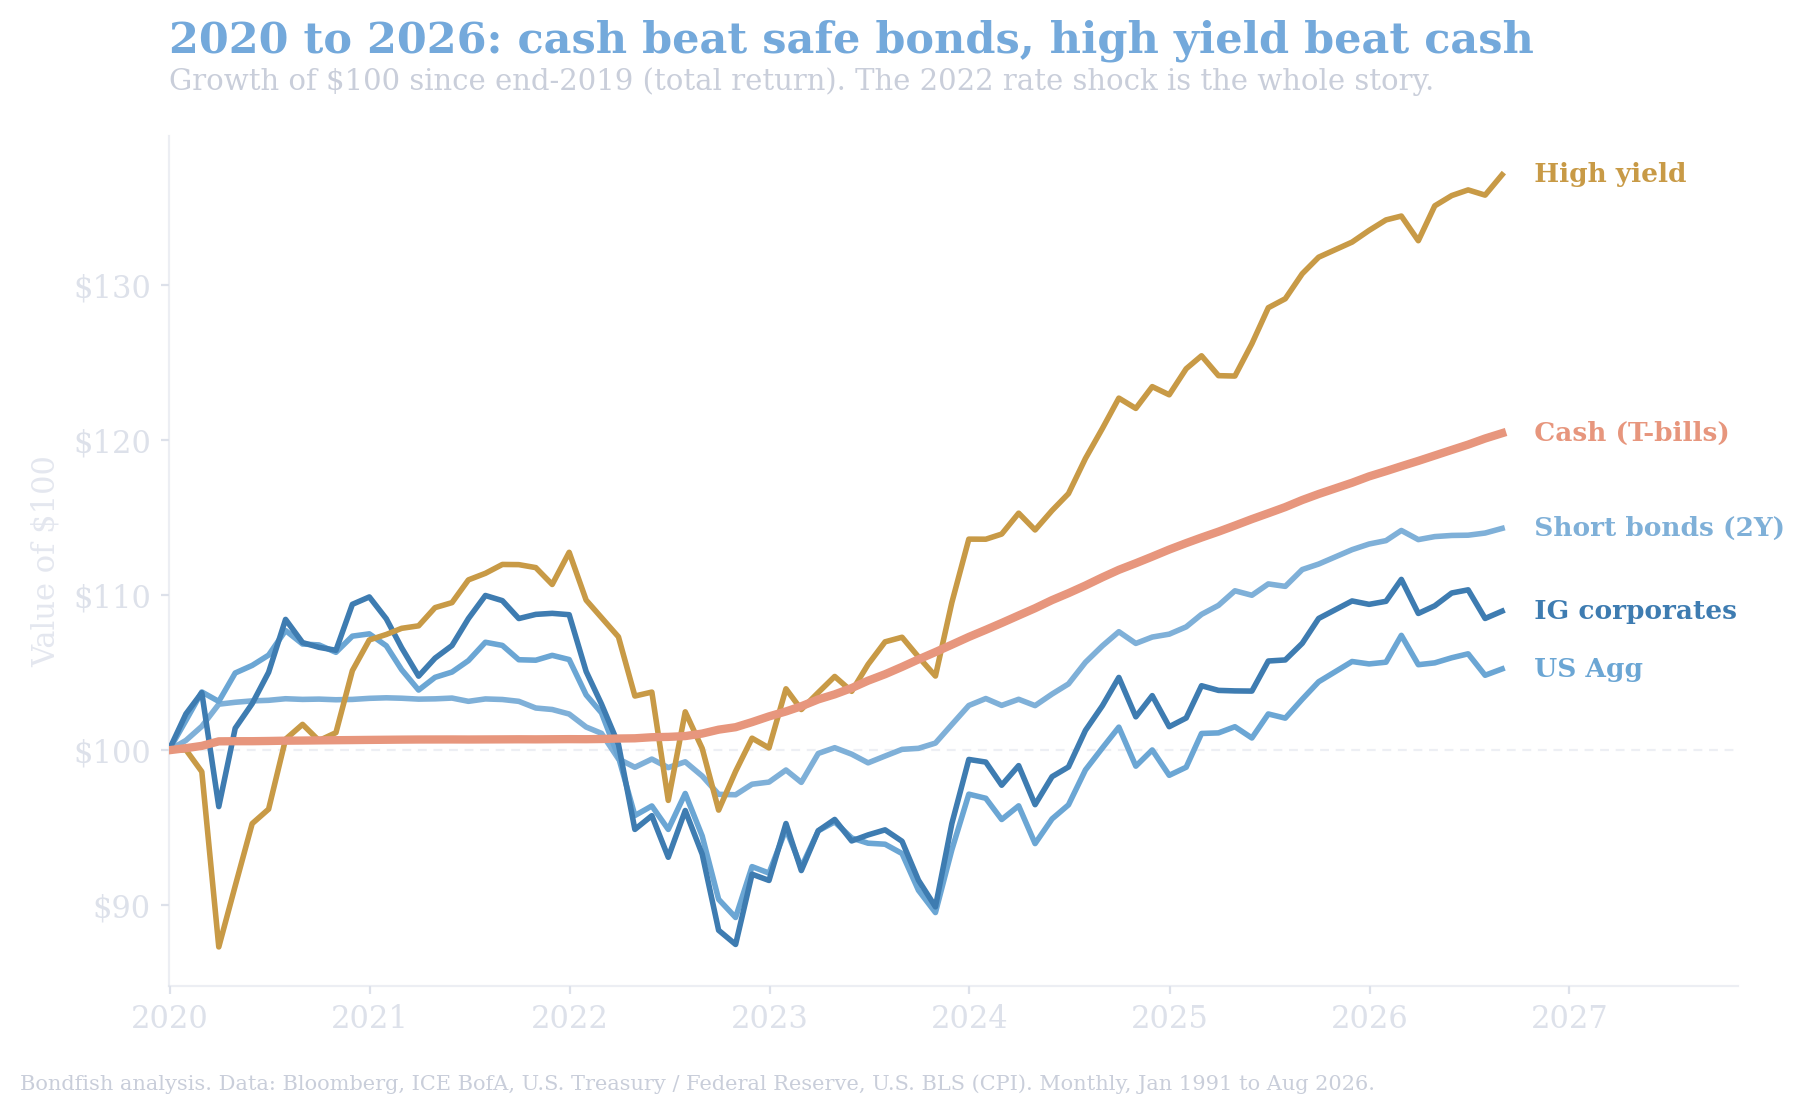 Growth of $100 since end-2019, total return. Cash beat the high-grade bond lines, but high yield beat cash. Source: Bondfish analysis; Bloomberg, ICE BofA.
But notice the red line on top. High-yield bonds returned 4.85% a year over the same stretch and turned $100 into about $137, comfortably ahead of cash. The moment you were willing to take credit risk instead of interest-rate risk, bonds beat cash even in cash’s best window. That extra return is not free: it comes with default and downgrade risk, so it is worth understanding the risks that come with high-yield bonds before reaching for the yield.
Here is the part the headline number hides. “Beating bonds” is not the same as making money. Adjust for inflation and cash’s 2.83% a year becomes minus 1.18% a year in real terms over 2020 to 2026. In plain language, a T-bill investor protected their principal and quietly lost purchasing power the whole time, because inflation ran hotter than the bill yield for much of the period. This is the same force that erodes bond returns when inflation rises, and it hit cash too.
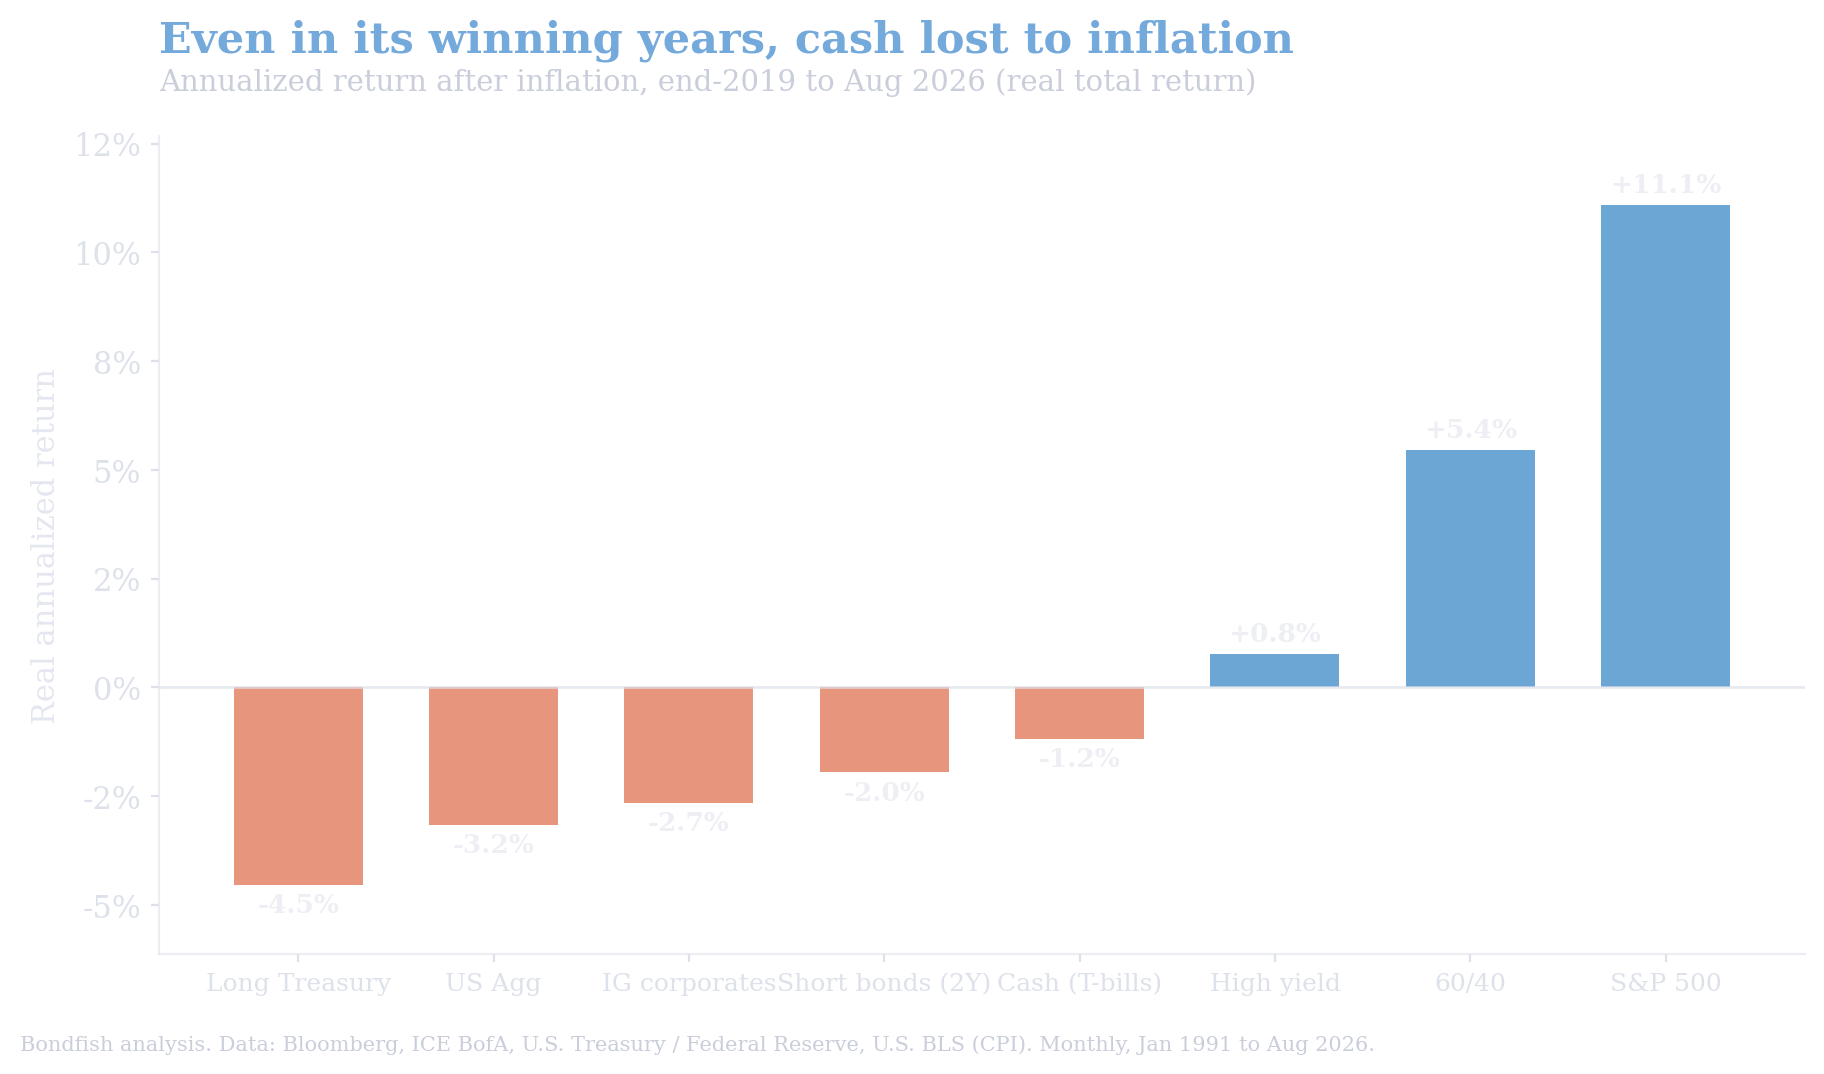 Real (after-inflation) annualized return, end-2019 to August 2026. Cash won against safe bonds but still lost purchasing power. Source: Bondfish analysis; U.S. BLS (CPI), Bloomberg, ICE BofA.
And winning against bonds is a low bar. Over the very same window a plain 60/40 portfolio turned $100 into $186 and returned 5.45% a year after inflation. Cash beat bonds; it did not beat a portfolio. The gap between $120 and $186 is the real cost of sitting in the money market fund while the “T-bill and chill” trade felt safe.
Cash beat bonds. It did not beat inflation, and it did not beat a portfolio.
None of this says cash is a mistake. It says cash is a tool with one job. A few takeaways from the data:
If you would rather own individual bonds than a fund, you can filter by yield, maturity and credit rating with the Bondfish bond screener to see what today’s roughly 4% to 5% yields look like across the market.
Over 35 years, cash was the worst asset you could hold, and bonds beat it comfortably. The 2020s flipped that briefly: the 2022 crash let cash beat high-grade bonds for the first time in a generation. But cash still lost to inflation, high yield still beat cash, and a simple 60/40 left cash far behind. “T-bill and chill” kept your money safe and slowly made it smaller. Bonds are not there to beat cash next quarter; they are there to out-earn it over time and to pay you now that yields are back.
This article is for general information only and is not investment advice. Bond investing involves risk, including possible loss of principal, and past performance does not guarantee future results. Backtested strategy returns are hypothetical and do not reflect fees, taxes or trading costs. Consider your own circumstances or consult a licensed financial professional before investing.