Inflation-Linked Bonds Explained: When They Pay Off
Inflation-linked bonds explained simply: they protect what your money can buy, not the price of the bond. Hold one to maturity and you get inflation plus a fixed real yield. Sell it early and the price can fall hard. A 30-year U.S. TIPS lost 41% in 2022, even though inflation added 7.7% to its principal.
They also do not always beat ordinary bonds. Since 2003, a 10-year linker beat a 10-year Treasury in 85 of 165 purchase months. It won only when inflation came in higher than the market expected.
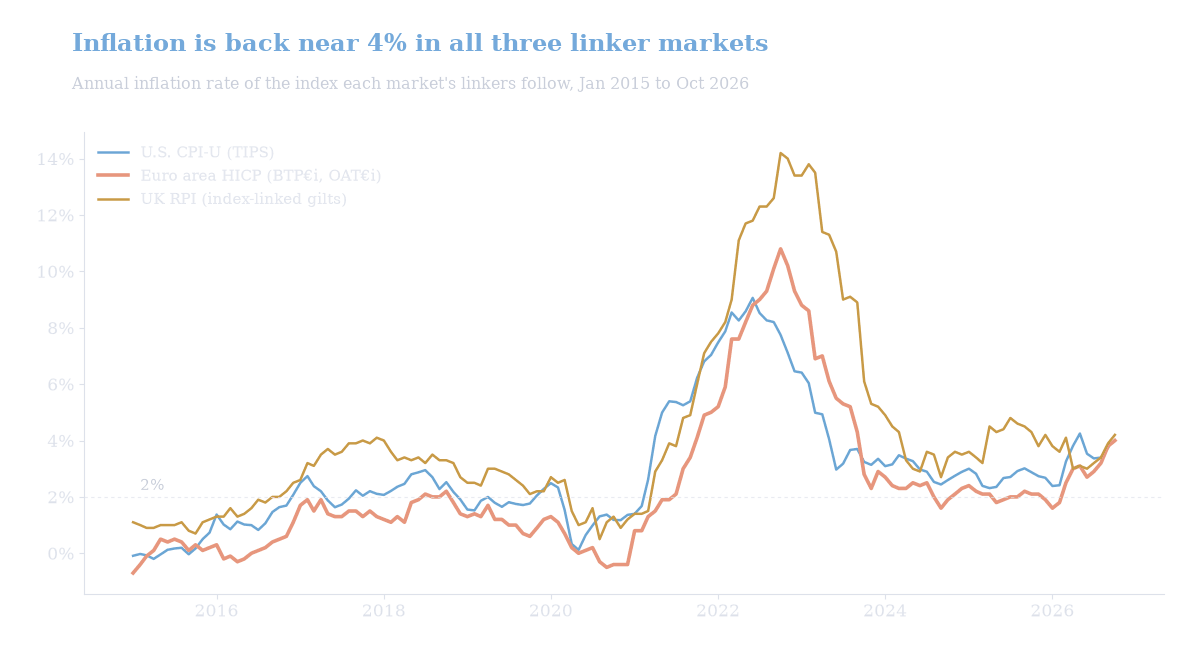
Inflation is back, near 4% in the euro area, the U.S. and the UK. So readers ask us: how do these bonds work, and is now a good time to buy? Here are the answers, with official data and one real bond.
How inflation-linked bonds work
An inflation-linked bond, or linker, is a government bond whose principal grows with consumer prices.
The coupon rate is fixed, but it is paid on the grown principal. So the cash coupon grows too. If inflation runs at 4% a year, the principal and each coupon grow about 4% a year.
One number does the work, the index ratio:
Index ratio = Reference index today ÷ Reference index at the start
Adjusted principal = Face value × Index ratio
Coupon paid = Real coupon rate × Adjusted principal
Inflation reaches the bond two to three months late. Prices are published weeks after the month they measure, so issuers use an older index.
Most issuers also add a deflation floor. At maturity, U.S. TIPS, Italy’s BTP€i and France’s OAT€i repay at least the original face value. UK index-linked gilts have no floor.
Two details matter. The floor works only at maturity. And it protects the face value, not the price you paid.
A linker promises purchasing power at maturity. It promises nothing about the price on the way there.
A worked example: $10,000 in a real TIPS
Take the 10-year TIPS due 15 January 2032 (ISIN US91282CDX65). The U.S. Treasury sold it in January 2022 at a real yield of −0.5%. Yes, negative.
So buyers paid a premium: $10,000 of face value cost about $10,700. Here is the same position in November 2026:
| Item | Jan 2022 | Nov 2026 |
|---|---|---|
| Index ratio | 1.00 | 1.21 |
| Adjusted principal | $10,025 | $12,122 |
| Price, per 100 | 107 | 88 |
| Market value | $10,709 | $10,638 |
Source: U.S. Treasury (auction records, FedInvest end-of-day prices); U.S. BLS via FRED; Bondfish analysis. $10,000 face value.
Inflation did its job. Prices rose 21%, and so did the principal.
But the price fell from 107 to 88, because real yields went up. Five-year TIPS, the maturity this bond now has, paid 2.7% in November 2026.
With $63 of coupons, the position was worth about $10,700. That is almost flat in dollars, but a 17% loss in what the money can buy (Bondfish analysis). An ordinary 10-year Treasury bought a month later lost 4.8%.
Held to 2032, the bond repays at least $10,000, and more if prices rise. Over its whole life, the buyer at the auction earns the real yield locked in that day: −0.5% a year, whatever inflation does.
Real yield, nominal yield and breakeven inflation
To compare a linker with an ordinary bond of the same maturity, look at three yields:
- Nominal yield: what the ordinary bond pays, its yield to maturity.
- Real yield: what the linker pays on top of inflation.
- Breakeven inflation: the gap between the two. At this average inflation, both bonds pay the same.
Breakeven inflation ≈ Nominal yield − Real yield
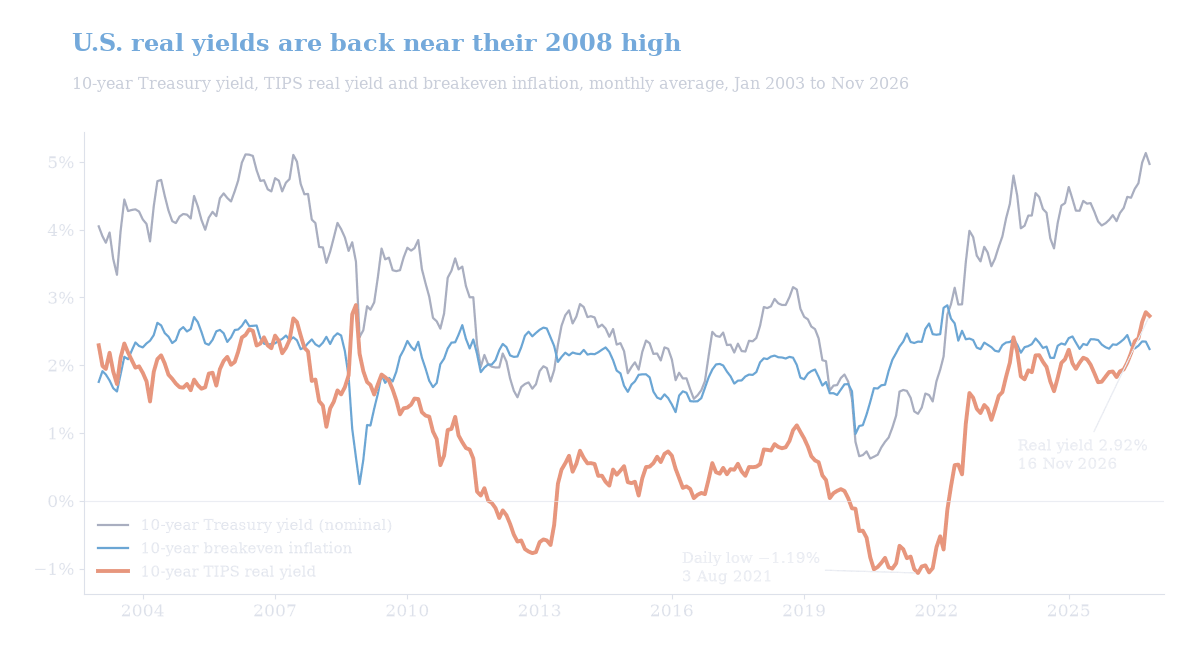
In November 2026, a 10-year Treasury paid 5.1%. A 10-year TIPS paid 2.9% plus inflation. So the breakeven was 5.1% − 2.9% = 2.2%.
If U.S. inflation averages more than 2.2% a year for ten years, the TIPS wins. If less, the Treasury wins.
And real yields have rarely been this high. The 10-year TIPS yield reached nearly 3% in October 2026, the highest since 2008. In August 2021 it was −1.2%.
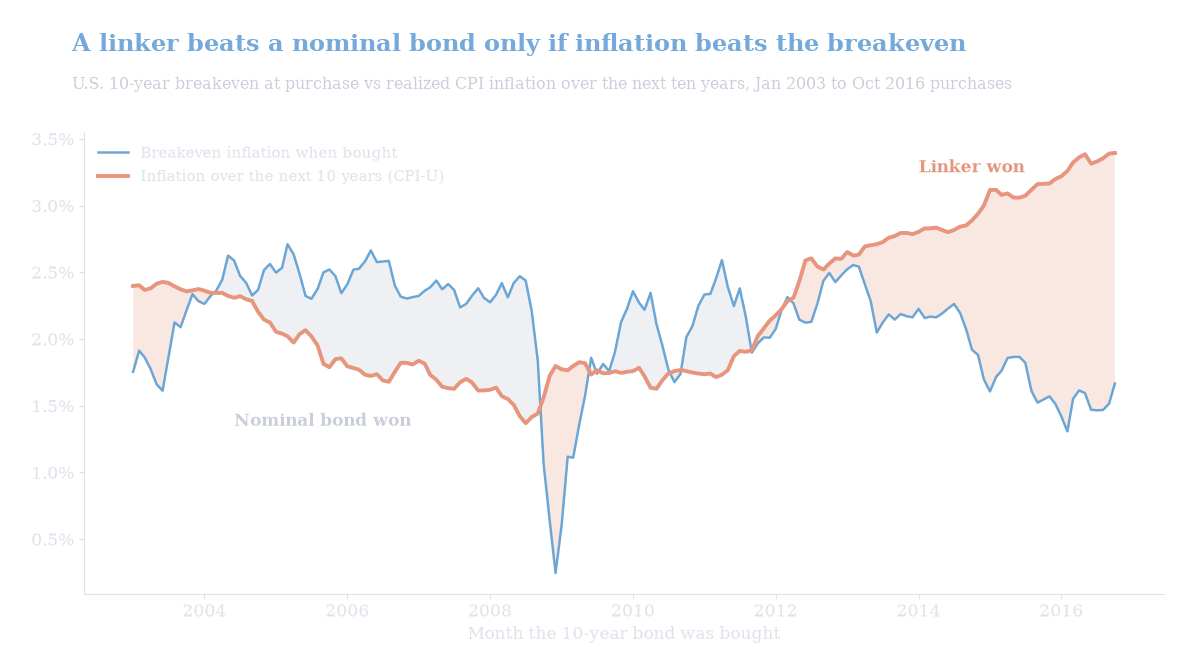
The breakeven is the hurdle. A linker beats a nominal bond only if inflation clears it.
Do inflation-linked bonds beat nominal bonds? 165 purchase months since 2003
How often was the hurdle cleared? We took every month from January 2003 to October 2016. For each, we compared the 10-year breakeven of that month with the U.S. inflation of the next ten years. When inflation came in higher, the linker won.
The test is rough: it ignores the indexation lag, coupons and taxes. October 2015 is left out, as its end month has no CPI.
| Bought in | Linker won | Breakeven paid | Inflation got |
|---|---|---|---|
| 2003 to 2008 | 17 of 72 | 2.3% | 1.9% |
| 2009 to 2012 | 23 of 48 | 2.0% | 2.0% |
| 2013 to 2016 | 45 of 45 | 1.9% | 3.0% |
| All months | 85 of 165 | 2.1% | 2.2% |
Source: FRED (T10YIE); U.S. BLS via FRED (CPI-U, NSA); Bondfish analysis. Purchase months January 2003 to October 2016, October 2015 excluded.
On average, the market got it almost right. It priced 2.1% a year, and 2.2% came.
Surprises decided the winner. Buyers from 2003 to 2008 paid for inflation that the quiet 2010s never delivered. Buyers from 2013 to 2016 paid less than 2%, then got the price surge of 2021–2023.
A linker is insurance against an inflation surprise, fairly priced on average.
Why inflation-linked bonds lost money in 2022
In 2022, U.S. prices rose 9.1% in the year to June. Linkers still fell.
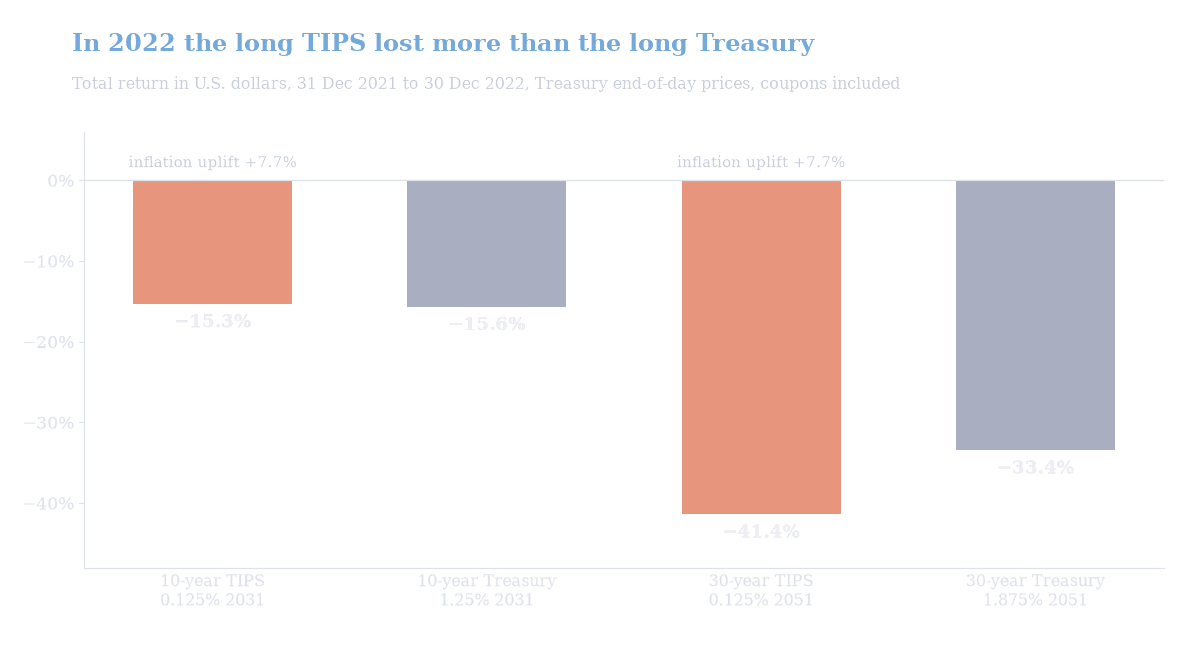
The reason is the real yield. In 2022 the 10-year real yield rose from −1.0% to 1.6%, and the 30-year from −0.4% to 1.7%. When yields rise, bond prices fall.
We priced four real bonds with the Treasury’s end-of-day prices, coupons included:
| Bond | Inflation uplift 2022 | Return 2022 | Return to Nov 2026 |
|---|---|---|---|
| 10-year TIPS, due 2031 | +7.7% | −15.3% | −2.8% |
| 10-year Treasury, due 2031 | none | −15.6% | −7.2% |
| 30-year TIPS, due 2051 | +7.7% | −41.4% | −51.0% |
| 30-year Treasury, due 2051 | none | −33.4% | −38.9% |
Source: U.S. Treasury (FedInvest end-of-day prices, TIPS auction records); U.S. BLS via FRED; Bondfish analysis. Total return in U.S. dollars, coupons included, not reinvested.
Inflation added 7.7% to the TIPS principal. But the price of the 30-year TIPS fell by almost half.
It lost more than the ordinary 30-year Treasury because of its duration. With a coupon close to zero, almost all of its value sat in the final payment in 2051. So the same rise in yields hit it harder.
The longer the linker, the more its price moves.
A fund of linkers never matures, so the floor and the locked-in real yield do not apply to it (see Bond Ladder vs Bond Fund). For a known real income on known dates, build a TIPS ladder of single bonds.
TIPS, BTP€i, BTP Italia, OAT€i and index-linked gilts compared
The mechanics are the same everywhere. The index, the floor and the coupon dates are not.
The index matters most. A linker protects you against the inflation of its index, which may not be your own.
| Bond | Index | Coupons | Floor at maturity |
|---|---|---|---|
| U.S. TIPS | U.S. CPI-U (BLS) | Twice a year | Yes, original principal |
| Italy BTP€i | Euro area HICP excluding tobacco | Twice a year | Yes, nominal value |
| Italy BTP Italia | Italian FOI index excluding tobacco (ISTAT) | Twice a year, uplift paid every six months | Yes, no negative revaluation |
| France OAT€i | Euro area HICP excluding tobacco | Once a year, 25 July | Yes, par |
| UK index-linked gilts | UK RPI | Twice a year | No |
Source: TreasuryDirect; MEF Department of the Treasury (Italy); CNO, Inflation-linked bonds (2011); UK Debt Management Office. Read on 18 November 2026.
U.S. TIPS come in 5, 10 and 30 years, from $100. For a euro or sterling investor they add currency risk. And they protect against U.S. inflation, not yours.
BTP€i and OAT€i follow euro area inflation excluding tobacco. It was 4.0% in October 2026, after a peak of 10.8% in 2022. BTP Italia follows Italian inflation instead, and pays the uplift in cash every six months. Germany stopped issuing linkers in 2024.
A linker also carries the credit of its government. An OAT€i protects against euro inflation, not against a wider French spread (see France’s Budget Crisis).
UK index-linked gilts follow the RPI and have no deflation floor. The RPI may be aligned with the lower CPIH measure from February 2030.
Since 2010, the RPI has run about 1.2 points a year above CPIH (Bondfish analysis of ONS data). So for a gilt that matures after 2030, the uplift of the later years is likely to be smaller.
Inflation-linked bonds today: what the numbers say
November 2026 points two ways.
Inflation is near 4%. And a 10-year TIPS bought now locks in about 2.9% a year above U.S. inflation, against about −1% in 2021.
But the breakeven of 2.2% says the market expects U.S. inflation to fall back toward 2%. If it does, an ordinary Treasury at 5.1% will do about as well.
Our view, not a forecast: the case for linkers today rests on the real yield, not on the inflation headline. Near 3%, the insurance is cheap. Whether inflation beats 2.2% a year for ten years, nobody knows.
When inflation-linked bonds disappoint
- Real yields rise before you sell. The price falls, and the longer the bond, the more.
- Inflation stays below the breakeven. The ordinary bond wins.
- Deflation. The floor works only at maturity, on the face value. A premium paid above 100 is not protected.
- The wrong index. Euro area inflation can differ from your country’s, and the UK’s RPI will change from 2030.
- Currency. A foreign linker protects against foreign inflation. The exchange rate can wipe out the uplift.
- Credit and liquidity. A linker carries its government’s credit risk, and it trades less than an ordinary bond.
- Taxes. In the U.S., a change in the principal may affect federal taxes in the year it happens. Elsewhere, check how the uplift is taxed.
How to choose an inflation-linked bond
- Match the index to your spending. Euro savers: BTP€i, OAT€i or BTP Italia. Dollar savers: TIPS. Sterling savers: index-linked gilts.
- Match the maturity to when you need the money. Only then does today’s real yield become your real return.
- Compare real and nominal yields of the same maturity. The gap is the inflation you need just to break even.
- Check the price. If you pay well above 100, the floor is below what you paid.
- Mind the length. A short linker has little rate risk. A long one is a big bet on real yields.
- Find the bonds. In the Bondfish bond screener, open Special Bonds and press Only next to Inflation-linked bonds. Then filter by currency and maturity.
The Bottom Line
An inflation-linked bond is a contract for purchasing power at maturity.
Hold it to the end and you get inflation plus the real yield you locked in. Sell it early and you get whatever real yields allow. In 2022, a 30-year TIPS lost 41%.
It beats an ordinary bond only when inflation beats the breakeven. Since 2003, that happened in 85 of 165 U.S. purchase months.
Today the protection is cheap: a 10-year real yield of 2.9% against a breakeven of 2.2%. The question is not whether inflation will come. It is whether you want insurance against more inflation than the market expects.
Data and sources
United States
- Federal Reserve (H.15) via FRED, read 18 November 2026: 10-year TIPS real yield (DFII10), 5-year (DFII5), 30-year (DFII30), 10-year Treasury yield (DGS10), 5-year (DGS5), 30-year (DGS30), 10-year breakeven inflation (T10YIE).
- U.S. Bureau of Labor Statistics: CPI-U, not seasonally adjusted, via FRED, to October 2026; Consumer Price Index, October 2026, released 10 November 2026.
- U.S. Treasury: TIPS at TreasuryDirect; TIPS auction records (reference CPI, index ratios, auction yields); FedInvest end-of-day prices for 31 December 2021, 30 December 2022 and 17 November 2026. Read 18 November 2026.
Euro area
- Eurostat: HICP, monthly indices and rates of change (prc_hicp_minr), euro area, overall index excluding tobacco, to October 2026, read 18 November 2026.
- MEF Department of the Treasury (Italy): BTP€i and BTP Italia, read 18 November 2026.
- German Finance Agency: Inflation-linked Federal securities, read 18 November 2026.
- Comité de Normalisation Obligataire (CNO): Inflation-linked bonds, 2011, read 18 November 2026.
United Kingdom
- UK Debt Management Office: Index-linked gilts; consultation document of 2 December 2004. Read 18 November 2026.
- UK Statistics Authority: response to the joint consultation on reforming the RPI, 25 November 2020.
- Office for National Statistics: RPI 12-month rate (CZBH) and CPIH 12-month rate (L55O), to October 2026, read 18 November 2026.
Bondfish analysis
- Index ratios, the worked example, the 2022 and 2021–2026 returns, the breakeven test and the gap between RPI and CPIH are Bondfish’s own calculations from the data above. Reference CPI follows the three-month lag with daily interpolation; October 2025 CPI, never collected, is taken as the average of September and November 2025 for the two TIPS coupons that need it.
This article does not constitute investment advice or personal recommendation. Investments in securities and other financial instruments always involve the risk of loss of your capital. Past performance is not a reliable indicator of future results. Bondfish does not recommend using the data and information provided as the only basis for making any investment decision. You should not make any investment decisions without first conducting your own research and considering your own financial situation.