
Is the 60/40 portfolio back? On the numbers, yes. A portfolio of 60% U.S. stocks and 40% U.S. bonds recovered from its 2022 crash by early 2024 and has since climbed to new highs. What has not fully returned is the diversification that made it dependable: stocks and bonds are still moving in the same direction, so the mix is riskier than its long record suggests.
In 2022 the 60/40 portfolio did something it is not supposed to do. Both halves fell at once. U.S. stocks lost 18.1% for the year and the U.S. bond market lost 13.0%, the first time in more than 30 years that both were down in the same calendar year. Commentators wrote the obituary. Three years on, the same portfolio sits at a record high. The comeback is real, but the reason it broke has not gone away.
The 60/40 mix fell 15.8% in 2022, its second-worst calendar year since 1991. Only 2008 was worse, when it dropped 22.1%. What changed was the role of bonds. In 2008 the bond sleeve gained 5.2% and softened the equity crash. In 2022 the bond sleeve fell with stocks and made the loss deeper. Measured from its December 2021 peak to the September 2022 low, the 60/40 portfolio was down 20.1%.
The bond half was hit by the fastest rate-hiking cycle in 40 years. Rising yields push bond prices down, and because yields started near record lows, there was almost no income to cushion the fall. That is the opposite of how a bond sleeve is supposed to behave in a stock sell-off.
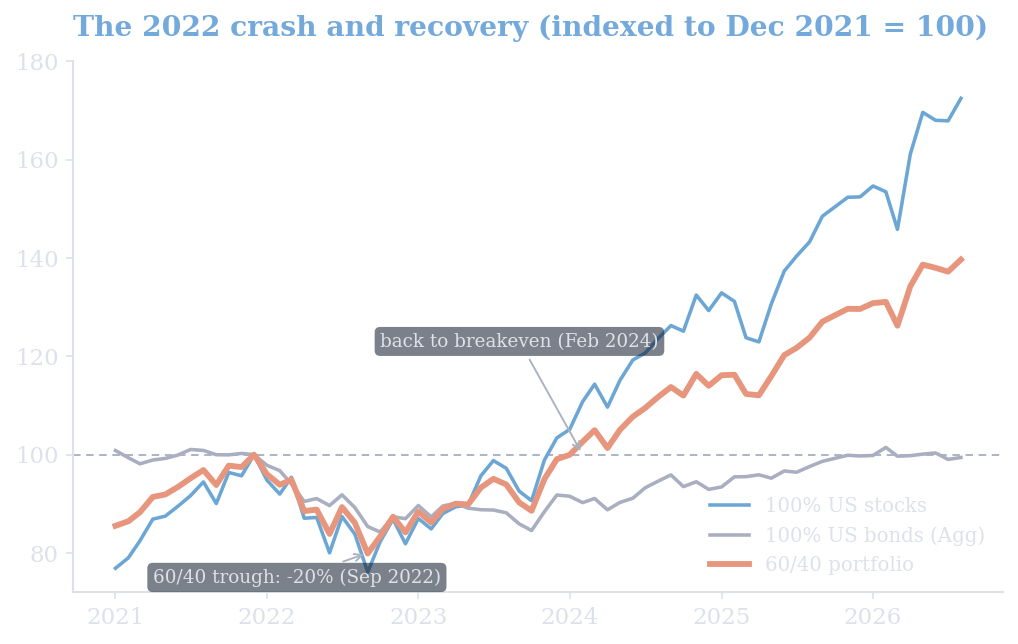
The 60/40 portfolio fell 20% into September 2022 and regained breakeven by February 2024. Source: S&P 500 total return from Robert Shiller; Bondfish analysis.
Yes. The 60/40 portfolio regained its December 2021 peak in February 2024, about 26 months after the top, and has made new highs since. At the end of August 2026 it stood at a record, and it was higher still in mid-September.
The recovery came from an unlikely place: stocks. A 100%-stock portfolio clawed back its old peak in December 2023, two months before the 60/40 did. The bond sleeve was the anchor. The U.S. Aggregate index only briefly recovered its 2021 level in early 2026 and has since drifted back below it, so bonds have delivered close to nothing for five years. In this cycle the "safe" half was the drag, and equities did the repairs.
The 60/40 portfolio works because its two halves usually move at different times. For two decades that held. From 2000 to 2021 the rolling correlation between monthly U.S. stock and bond returns averaged minus 0.09, so bonds tended to rise when stocks fell. In 2022 that relationship flipped. Since the start of 2022 the correlation has averaged plus 0.58, and it sits near plus 0.5 today.
This is the part of the story the recovery hides. A 60/40 portfolio at new highs is not the same as a 60/40 portfolio that diversifies. When both sleeves fall together, the mix carries more risk for the same return, and a repeat of 2022, an inflation shock that hits stocks and bonds at once, remains possible.
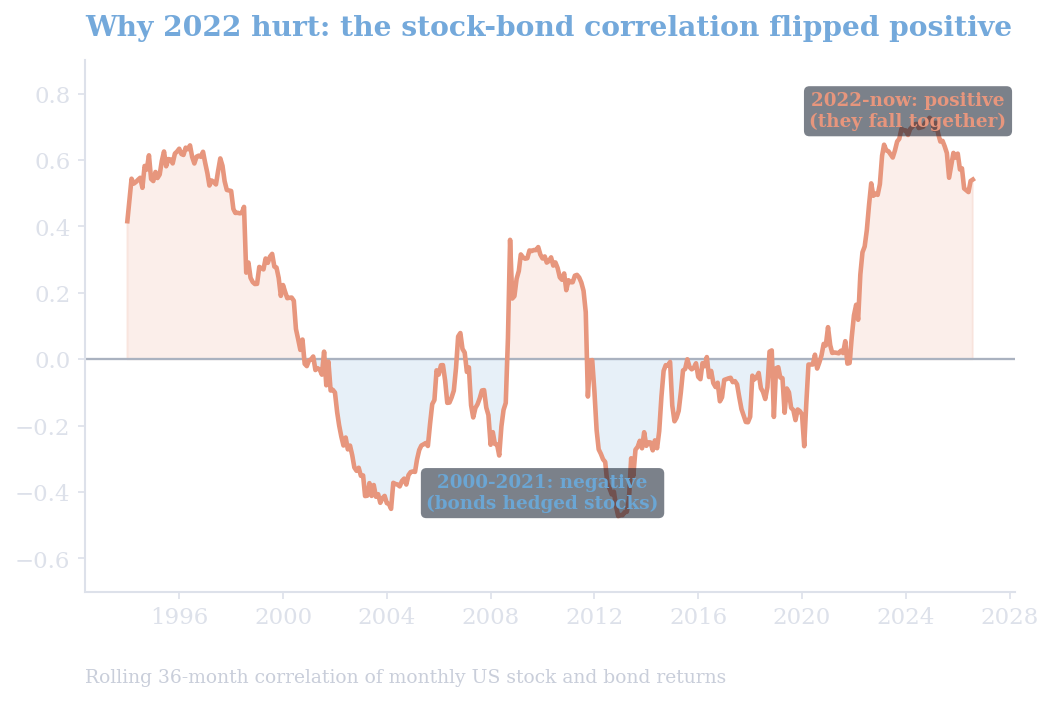
Bonds hedged stocks from 2000 to 2021, when the correlation was negative. Since 2022 the two have moved together. Source: S&P 500 total return from Robert Shiller; Bondfish analysis.
One caveat keeps this honest: the negative correlation was itself a phase, not a law. In the 1990s stocks and bonds were positively correlated too, at about plus 0.5. The reliable hedge that a generation of investors took for granted really belongs to the 2000 to 2021 window.
Step back from 2022 and the case for the mix is easier to see. Since 1991, $100 in the 60/40 portfolio grew to about $2,100, a return of 8.9% a year, or 6.2% after inflation. That trails 100% stocks, but with far smaller drops along the way.
| Portfolio (1991-2026) | Return a year | After inflation | $100 became | Deepest drop |
|---|---|---|---|---|
| 60/40 portfolio | 8.9% | 6.2% | $2,100 | -32.5% |
| 100% U.S. stocks | 11.3% | 8.5% | $4,490 | -50.9% |
| 100% U.S. bonds | 4.8% | 2.2% | $530 | -17.2% |
The worst peak-to-trough loss for 60/40 was 32.5% in 2008, against 50.9% for an all-stock portfolio. That is the trade the mix has always offered: less upside for a much smoother ride. If you build the bond half yourself, you can screen bonds by rating, yield and maturity with the Bondfish bond screener. 2022 was a reminder that the ride is smoother, not smooth.
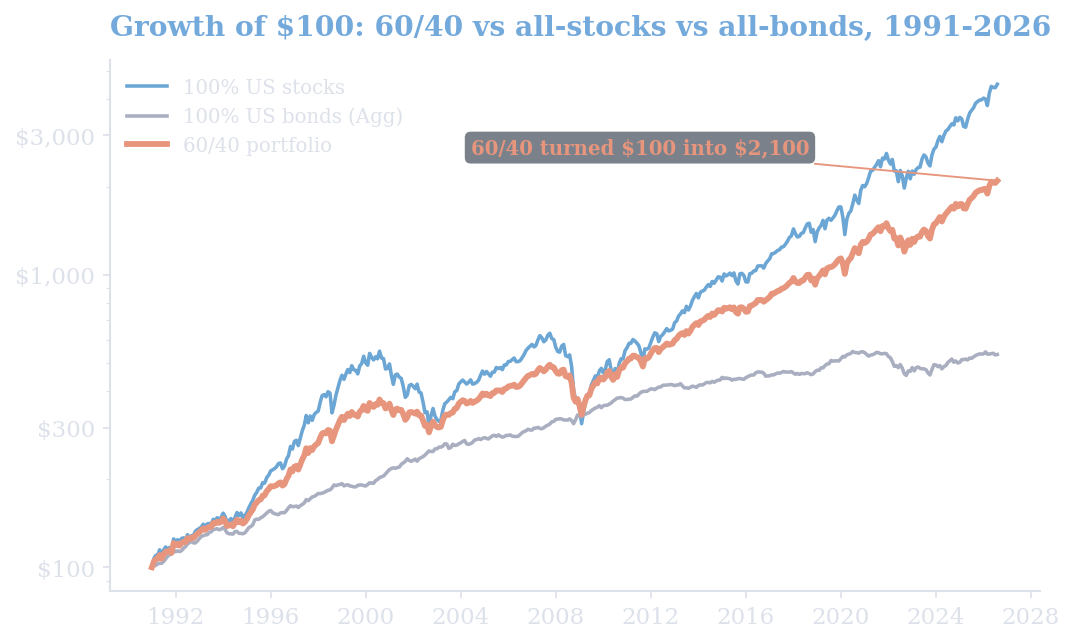
$100 in the 60/40 mix grew to about $2,100 since 1991, between all-stocks and all-bonds. Source: S&P 500 total return from Robert Shiller; Bondfish analysis.
A European investor's home version of 60/40 tells the same story with a sharper edge. Built from 60% euro-area stocks (the Euro Stoxx 50) and 40% euro-area bonds (a broad euro-area investment-grade bond index), the euro 60/40 fell 19.0% from its December 2021 peak to the September 2022 low, recovered to breakeven by December 2023, and is now at a record, slightly ahead of the U.S. schedule.
The euro bond sleeve took the harder hit. Euro-area bonds fell 17.2% in 2022, worse than the U.S. Aggregate's 13.0%, because German and French yields began the year negative and had further to climb. From their 2021 peak, euro bonds are still about 10% underwater. Euro-area inflation peaked at 10.6% in October 2022, per Eurostat, so the real loss for a euro saver was worse than the price chart alone shows.
Over 1999 to 2026 the euro 60/40 returned 4.6% a year, behind the 7.1% a U.S. 60/40 delivered in the same window. The gap is U.S. equities, not the structure. A home 60/40 broke in 2022 for the same reason the U.S. one did, and the stock-bond hedge has not fully reset in Europe either.
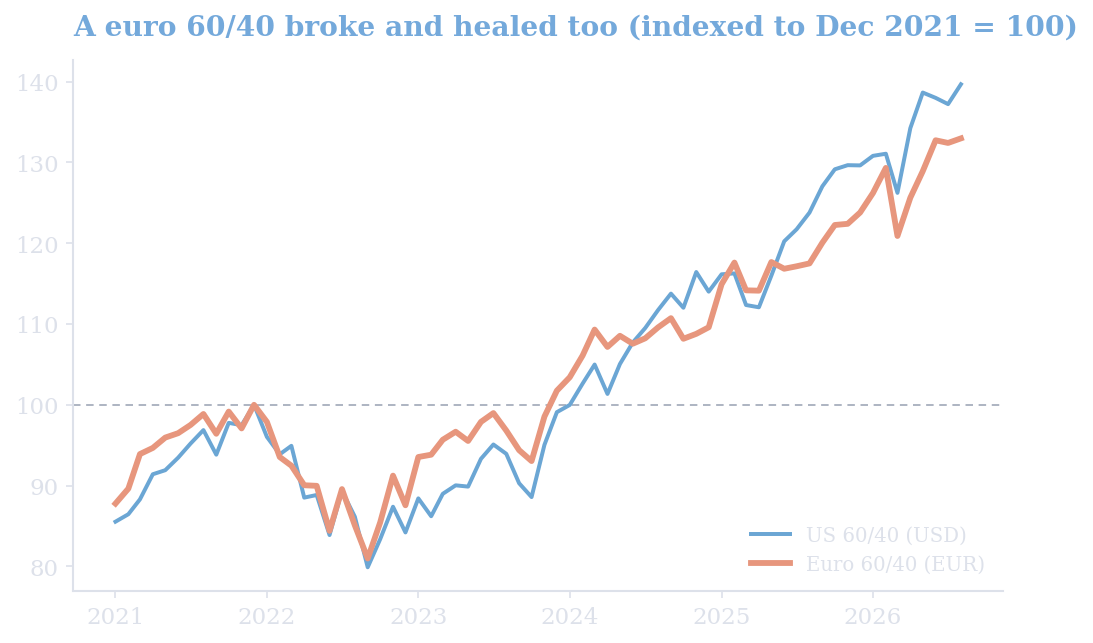
The euro 60/40 (in euros) and the U.S. 60/40 (in dollars) both crashed in 2022 and are now at records. Source: Euro Stoxx 50 and a euro-area bond index; Bondfish analysis.
The 60/40 portfolio is back where its value is easiest to measure. It recovered from the 2022 crash, sits at new highs, and over 35 years has paid 8.9% a year for a fraction of the pain of an all-stock portfolio. What is not back is the automatic hedge: stocks and bonds are still moving together, so treat 60/40 as a solid, lower-volatility core rather than the crash-proof machine it looked like from 2000 to 2021.
Data and method: U.S. equity returns use the S&P 500 total return from Robert Shiller's public dataset; euro equities use the Euro Stoxx 50 total return; bonds use broad U.S. and euro-area investment-grade bond indices; inflation is the U.S. Consumer Price Index and euro-area HICP. The 60/40, all-stock and all-bond series, drawdowns, recovery dates and correlations are Bondfish's own calculation, rebalanced monthly, through August 2026 (the last complete month; index levels are month-end). Past performance does not predict future returns.
Every return, drawdown, recovery date and correlation in this article is Bondfish's own calculation from public market data, rebalanced monthly, through August 2026. The underlying data:
This article is for general information only and is not investment advice. Bond and stock investing involves risk, including possible loss of principal. Consider your own circumstances or consult a licensed financial professional before investing.