

Under the 4 percent rule, bonds barely change how often a retirement portfolio runs out of money; what they change is how badly it fails. In 1,509 U.S. retirements starting between 1871 and 1996, a 4% inflation-adjusted withdrawal ran dry within 30 years in 2.1% of cases with 100% stocks and 2.6% with 60/40. But the worst all-stock retirement, which began in October 1929, was empty after 16.5 years, while the worst 60/40 retirement lasted 25.7 years. Holding 20% to 50% in 10-year Treasuries lifted the worst-case safe withdrawal rate from 3.07% to between 3.70% and 3.80%; putting more than half the portfolio in bonds made both typical and worst outcomes worse.
Thirty-two years after it was born, the 4% rule is still the most quoted number in retirement planning. Financial planner William Bengen introduced it in the October 1994 issue of the Journal of Financial Planning, after testing U.S. retirements from 1926 onward with portfolios of large-company stocks and intermediate-term Treasuries. He advised keeping 50% to 75% in stocks. The 1998 Trinity study by Philip Cooley, Carl Hubbard and Daniel Walz used high-grade corporate bonds instead and found that a 50/50 portfolio withdrawing 4% a year survived 95% of the 30-year periods from 1926 to 1995.
The debate has never settled. In his 2025 book A Richer Retirement, Bengen raised his own figure to 4.7%, using a broader mix of 55% stocks, 40% bonds and 5% cash. Morningstar went the other way: its December 2025 State of Retirement Income report put the safe starting rate for 2026 retirees at 3.9%, with the best results from portfolios holding only 30% to 50% in stocks, partly because bonds now yield more. Both camps hold bonds. So we isolated one question: with the same retirement and the same withdrawals, what does each extra slice of bonds actually do?
The rule itself is simple. In your first year of retirement, withdraw 4% of your portfolio. Every year after that, withdraw the same amount adjusted for inflation, whatever the markets do. On a $1 million portfolio, that means $40,000 in year one, rising with the cost of living.
For any retirement start date, the highest starting rate that would have lasted the full 30 years is that date’s safe withdrawal rate. The 4% rule is, in effect, a bet that your retirement won’t be worse than the worst one in the historical record.
Bonds come in because of sequence-of-returns risk: a crash early in retirement forces you to sell stocks at low prices to pay the bills, and the portfolio may never recover. Bonds are meant to be the part you sell instead while stocks recover.
Two caveats. Before 1989 the stock data are monthly averages, and bond yields before 1953 are smoothed annual figures, which makes the early record look a little calmer than it was. And the data are American because they are the longest continuous record; the logic carries over to other markets, but the exact numbers will not.
| Stocks / bonds | Ran out at 4% | Ran out at 4.5% | Worst safe rate | Left per $100 |
|---|---|---|---|---|
| 100% stocks | 2.1% | 7.0% | 3.07% | $318 |
| 90/10 | 1.6% | 7.0% | 3.40% | $276 |
| 80/20 | 1.6% | 7.4% | 3.72% | $226 |
| 70/30 | 2.0% | 8.6% | 3.80% | $177 |
| 60/40 | 2.6% | 10.9% | 3.76% | $133 |
| 50/50 | 3.4% | 13.3% | 3.70% | $96 |
| 40/60 | 4.8% | 22.3% | 3.63% | $67 |
| 30/70 | 10.9% | 33.7% | 3.54% | $46 |
| 20/80 | 24.9% | 47.2% | 3.34% | $29 |
| 100% bonds | 48.4% | 54.5% | 2.40% | $4 |
1,509 U.S. retirements starting February 1871 to October 1996, 30 years each. Bonds = 10-year Treasuries; portfolios rebalanced monthly; withdrawals raised with inflation; before fees and taxes. Worst safe rate = highest starting withdrawal that survived every start date. Left per $100 = median balance after 30 years at 4%, after inflation.
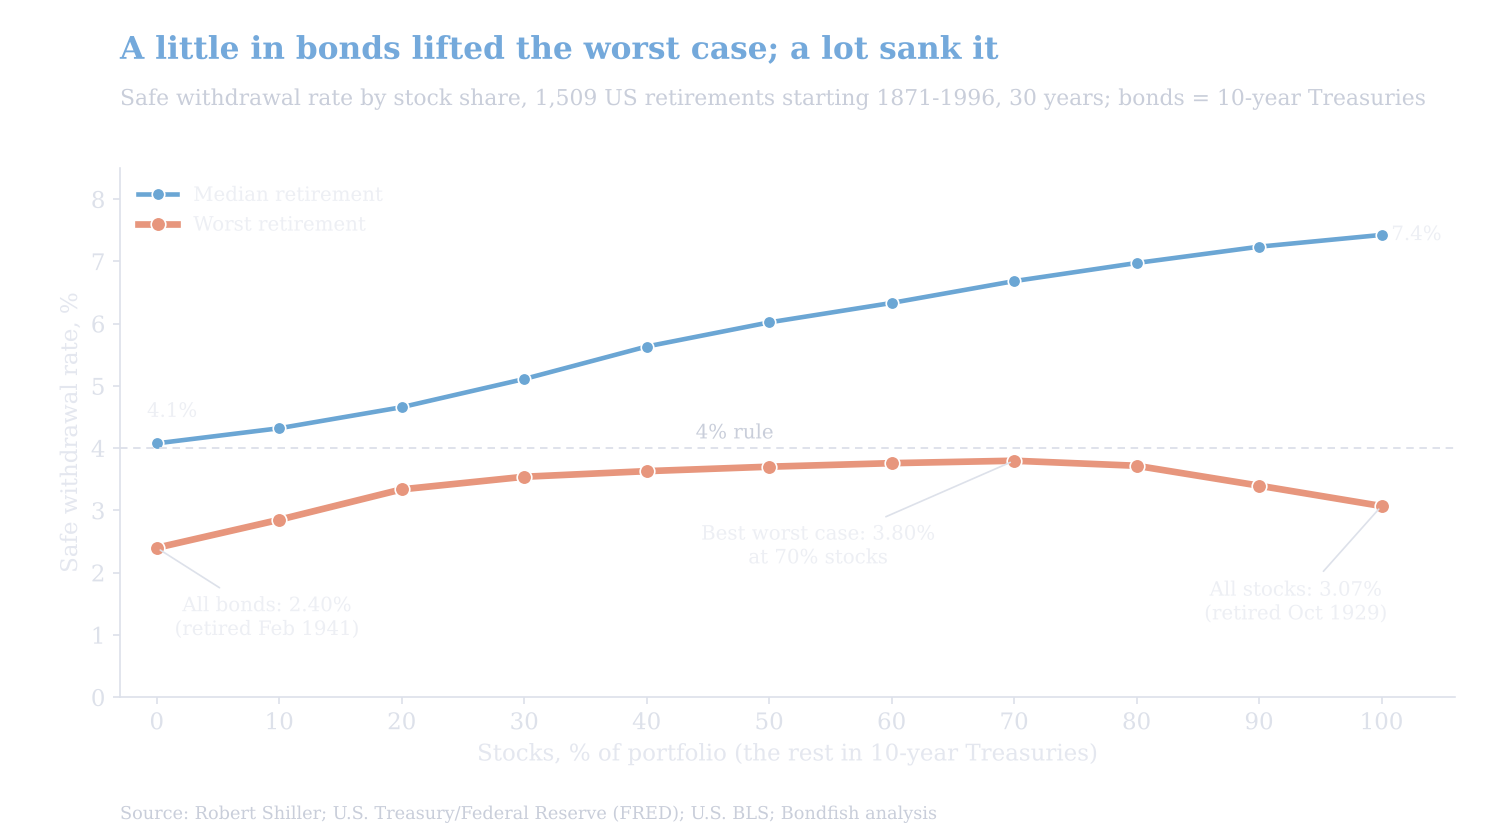
Highest starting withdrawal rate, raised with inflation, that lasted 30 years: worst and median of 1,509 U.S. retirements starting February 1871 to October 1996, by share of stocks (the rest in 10-year Treasuries), rebalanced monthly, before fees and taxes. Source: S&P 500 (S&P Dow Jones Indices, Robert Shiller); U.S. Treasury/Federal Reserve (FRED); U.S. Bureau of Labor Statistics; Bondfish analysis.
Three things stand out.
The price of bonds is what you leave behind. The typical (median) all-stock retiree withdrawing 4% ended 30 years with $318 for every $100 they started with, after inflation. A 60/40 retiree ended with $133, and an all-bond retiree with just $4.
Failure rates hide how badly a plan fails. Running out of money in year 29 and running out in year 16 are very different retirements.
For someone retiring at 65, that is the difference between running short at about 81 and at about 90.
Bonds helped in far fewer retirements than most investors assume. A 60/40 portfolio supported a higher safe withdrawal rate than all stocks in only 117 of the 1,509 start dates (7.8%); in 1,330 of them, all stocks would have been the best mix. But the few start dates where bonds won are the ones that define the 4% rule.
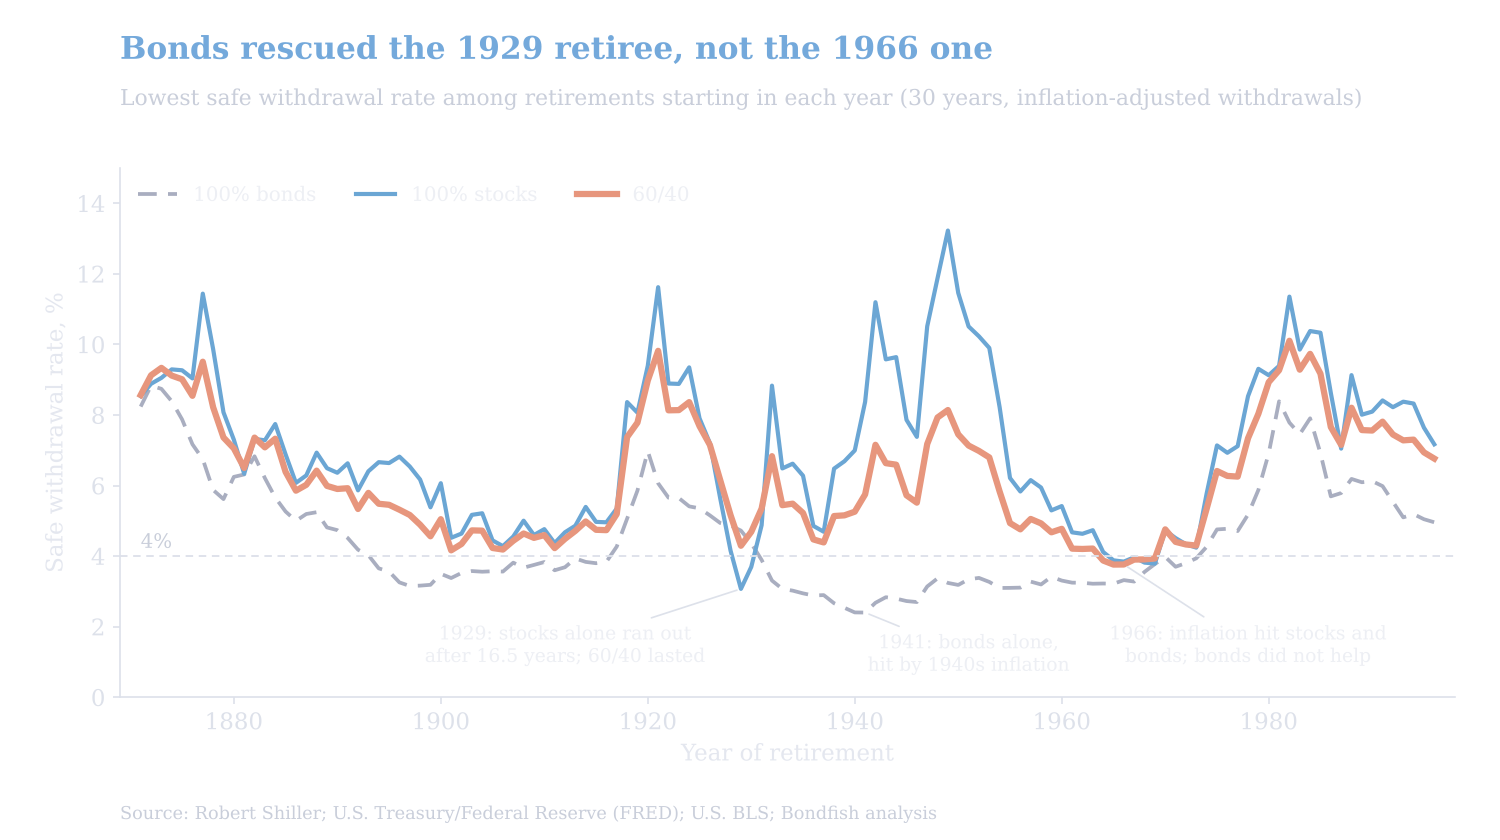
Lowest safe withdrawal rate among the retirements starting in each calendar year, 30 years, withdrawals raised with inflation. Bonds = 10-year Treasuries. Source: S&P 500 (S&P Dow Jones Indices, Robert Shiller); U.S. Treasury/Federal Reserve (FRED); U.S. Bureau of Labor Statistics; Bondfish analysis.
In other words, regular bonds are insurance against one kind of disaster: a deflationary bust, in which stocks crash and consumer prices fall, so each fixed bond payment buys more. They do little, and can be a drag, when the enemy is inflation, which is why every 60/40 retirement that ran out at 4% began between 1964 and 1969. It is the same reason how bonds react to inflation matters as much as how many of them you hold.
Recent history shows both sides. None of these retirements has finished 30 years yet, so the table shows where each stood in September 2026.
| Retired in | 100% stocks | 80/20 | 60/40 | 100% bonds |
|---|---|---|---|---|
| January 2000 | 5 | 41 | 55 | 35 |
| November 2007 | 194 | 155 | 117 | 35 |
| January 2022 | 115 | 100 | 87 | 55 |
Real portfolio value at the end of September 2026 as a share of the starting balance (start = 100), withdrawing 4% a year raised with inflation. Bonds = 10-year Treasuries.
A retiree who started in January 2000 with 100% stocks hit the dot-com crash and then 2008 within the first decade. Withdrawing 4%, they had just 5% of their starting balance left in real terms by September 2026 and were on course to run out before year 30. A 60/40 retiree still had 55%. From 2000 to 2002, stocks lost 37.6% in total while 10-year Treasuries gained 42.5%.
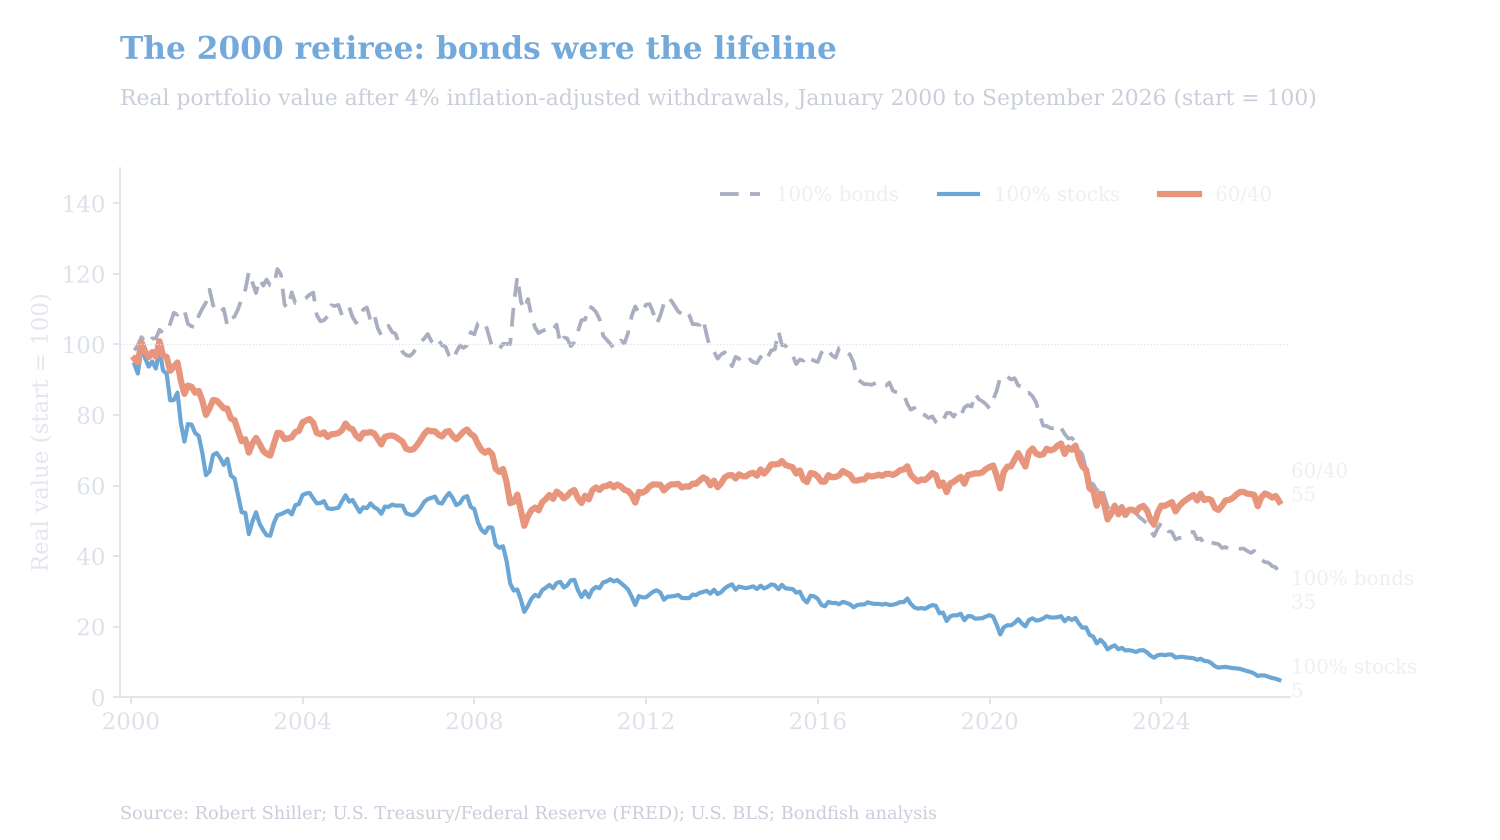
Portfolio value after inflation and after withdrawals of 4% of the starting balance a year, raised with inflation, January 2000 to September 2026. Bonds = 10-year Treasuries, rebalanced monthly. Source: S&P 500 (S&P Dow Jones Indices, Robert Shiller); U.S. Treasury/Federal Reserve (FRED); U.S. Bureau of Labor Statistics; Bondfish analysis.
Notice the all-bond line. It stayed ahead of 60/40 for more than 23 years, then fell from 73 at the end of 2021 to 46 by October 2023, as yields jumped and inflation pushed up the withdrawals. The 2022 retiree got the opposite of the 2000 one. In 2022, stocks fell 18.1% and 10-year Treasuries 16.4%, while consumer prices rose 6.5%. Bonds offered no cushion: by September 2026, an all-bond 2022 retiree had 55% of the starting balance left in real terms, against 87% for 60/40 and 115% for all stocks. The November 2007 retiree, who started a month after the pre-crisis stock market peak, shows that stocks can also win a bad start: 2008 hurt, but the long bull market that followed more than made up for it, leaving an all-stock portfolio at 194% of its starting value in real terms against 117% for 60/40.
Bengen used intermediate-term Treasuries; the Trinity study used high-grade corporate bonds. Comparing bond types needs data for all of them, which narrows the test to retirements starting from 1962 to 1996. That window includes the 1966 disaster but not 1929.
| Bond used | Worst safe rate | Ran out at 4% | Left per $100 | All bonds: ran out |
|---|---|---|---|---|
| 3-month T-bills | 3.95% | 1.7% | $158 | 56.4% |
| 5-year Treasuries | 3.93% | 1.7% | $228 | 20.4% |
| 10-year Treasuries | 3.76% | 9.4% | $264 | 27.8% |
| Long-term Treasuries | 3.48% | 17.0% | $324 | 33.1% |
| Aaa corporates | 3.50% | 14.6% | $346 | 24.9% |
60/40 portfolio with each type of bond, U.S. retirements starting February 1962 to October 1996, 4% withdrawals raised with inflation, rebalanced monthly. Long-term Treasuries and Aaa corporates modeled as 25-year bonds. All bonds = a portfolio of nothing but that bond.
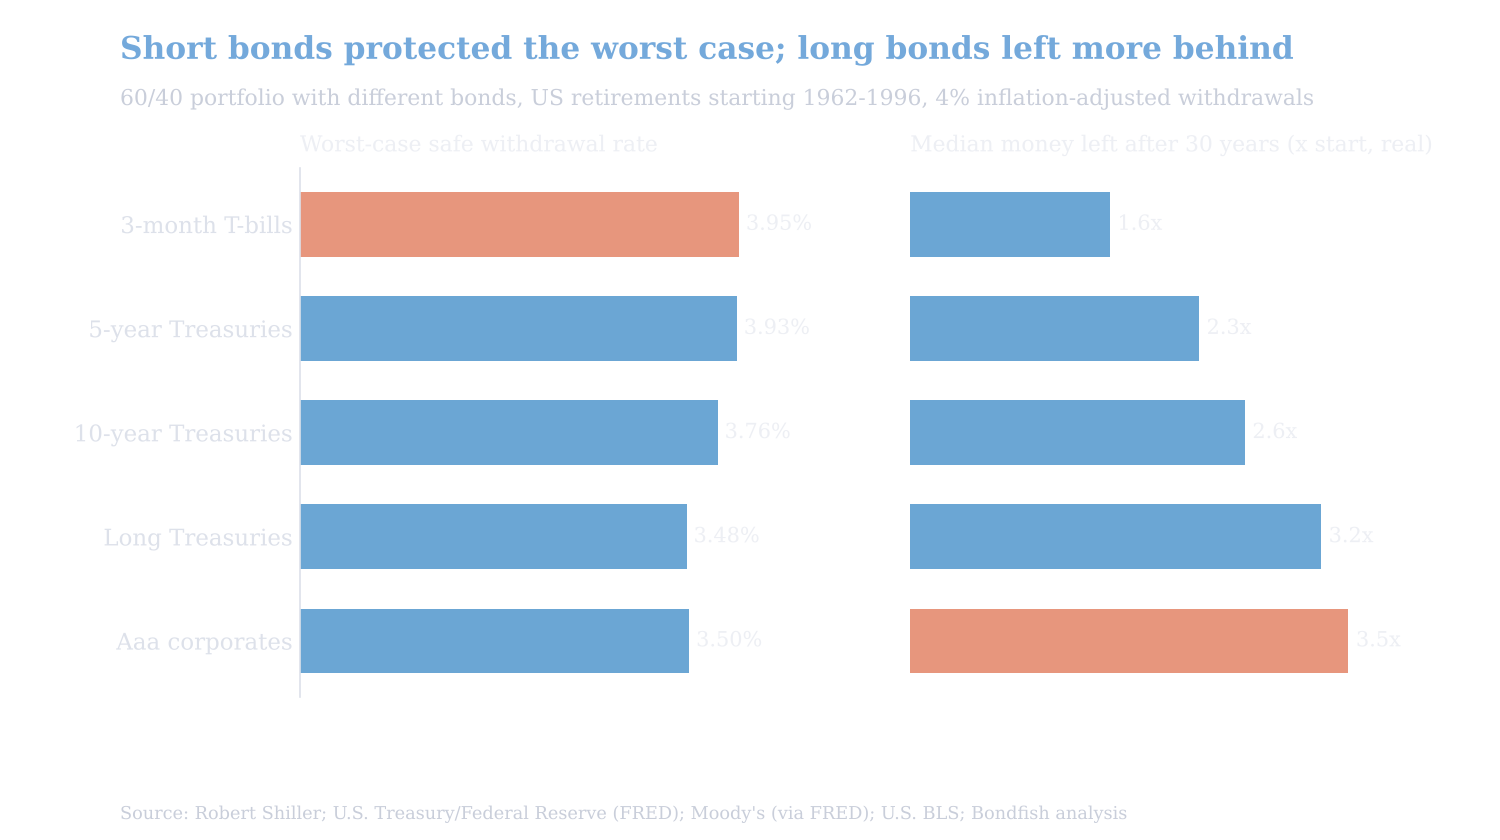
60/40 portfolio using each type of bond, U.S. retirements starting February 1962 to October 1996, 4% withdrawals raised with inflation, rebalanced monthly. Long-term Treasuries and Aaa corporates modeled as 25-year bonds. Source: S&P 500 (S&P Dow Jones Indices, Robert Shiller); U.S. Treasury/Federal Reserve (FRED); Moody’s (via FRED); U.S. Bureau of Labor Statistics; Bondfish analysis.
No single bond won every disaster. Ten-year Treasuries were the hero in 1929; in the 1966 inflation, shorter bonds held up better. (Our T-bill data start in 1934, so we cannot test them on 1929.)
Starting yields matter far more for bonds than for stocks. Across our 1,509 retirements, the correlation between the 10-year yield on retirement day and the safe withdrawal rate was 0.66 for an all-bond portfolio, 0.47 for 60/40 and only 0.20 for all stocks.
On October 29, 2026, the 10-year Treasury yielded about 5.0% and the 30-year about 5.3%. That is the backdrop for the case for holding more bonds. But a high nominal yield is not enough on its own. In February 1966 the 10-year also yielded 5.02%, and that month began the worst 60/40 retirement among all start dates with a yield of 5% or more, because inflation then ran far above that yield.
What is different now is that retirees can lock in a real, after-inflation yield. Treasury Inflation-Protected Securities (TIPS) maturing in 20 and 30 years yielded about 3.1% above inflation on October 29. In month-end data back to 2004, the 30-year TIPS yield has been higher only in October 2008 and September 2026. A ladder of TIPS maturing each year for 30 years, bought at those yields, would pay about 4.9% of the starting amount a year, raised with inflation and backed by the U.S. government, if held to maturity. In November 2021, when real yields were negative, the same ladder would have paid only about 3.0%.
That compares well with the 4% rule, but it is not the same thing. A TIPS ladder spends the money down to zero in year 30, so it leaves nothing for heirs or for a longer life, and TIPS are U.S. securities with their own tax rules. Investors elsewhere can use inflation-linked government bonds in their own currency, which France, Italy and the U.K., among others, issue. A bond ladder calculator helps plan the rungs, and you can screen government bonds by maturity and yield on Bondfish.
Bonds are not what makes the 4 percent rule work. In 155 years of U.S. data, stocks did most of the work, and between 50% and 100% stocks the failure rate at 4% barely moved. What bonds bought was protection against the worst sequence on record, the 1929 crash: they lifted the worst-case safe withdrawal rate from 3.07% to about 3.80% and pushed the earliest failure at 4% from 16.5 years to 25.7 years. They did nothing against inflation, and holding too many of them led to slow failure. With real yields near 3%, the best bonds for a 4% retiree today may be the ones protected against inflation.
S&P 500 total return: Robert Shiller’s U.S. stock market data (monthly averages, 1871–1989) and month-end S&P 500 total return index levels (from October 1989). 10-year Treasury yields: Robert Shiller (to 1961), U.S. Treasury and Federal Reserve via FRED (from 1962). T-bill, 5-year and long-term Treasury yields: U.S. Treasury and Federal Reserve (FRED). Corporate bond yields: Moody’s seasoned Aaa corporate bond yield (via FRED). U.S. consumer prices: Robert Shiller (to 1912) and U.S. Bureau of Labor Statistics (from 1913). Current Treasury and TIPS yields: U.S. Treasury market yields at the October 29, 2026 close. Bond returns, portfolio returns, withdrawal simulations and the TIPS ladder payout (real yields interpolated across maturities) are Bondfish’s own calculation.
This article is for general information only and is not investment advice. Investing involves risk, including possible loss of principal. Past performance and historical backtests do not guarantee future results. Withdrawal rates depend on your own circumstances, taxes and other income; consider consulting a licensed financial professional before making retirement decisions.