

A risk parity portfolio for retail investors, with stocks and 10-year Treasuries weighted so that each contributes the same risk, returned 8.1% a year from January 1973 to September 2026, against 9.4% for a 60/40 portfolio, with less volatility (7.8% a year against 10.0%). But it did not deliver more return per unit of risk: its Sharpe ratio was 0.46 against 0.50 for 60/40. Risk parity won on that measure only during the 1982–2020 bond bull market, and leverage, the tool risk parity funds use to lift returns, turned 2022 into a 27.5% loss.
Risk parity is one of the most influential ideas in institutional investing. Bridgewater Associates launched its All Weather strategy, built on the principle, in 1996, and Edward Qian of PanAgora Asset Management coined the term “risk parity” in 2005. Since December 2019, retail investors have been able to buy it off the shelf: first through the RPAR Risk Parity ETF, then its more leveraged sibling UPAR in 2022 and, in March 2025, the SPDR Bridgewater All Weather ETF (ALLW).
Most of these funds borrow to work, though, and borrowing is exactly what many retail investors want to avoid. So we asked two questions. What does risk parity deliver with no leverage at all? And is the leveraged version worth the extra risk?
A risk parity portfolio divides risk, not money, equally among its assets. The usual yardstick of risk is volatility, how much an asset’s returns swing from year to year.
The idea starts from a flaw in the classic 60/40 portfolio. Stocks have been nearly twice as volatile as 10-year Treasuries (15.3% a year against 8.2% in our data), so in a 60/40 mix they supply about 87% of the total risk. The 40% in bonds barely moves the needle. Your result is mostly a stock-market result.
Risk parity fixes that by holding more of the calmer asset. With two assets, equal risk means each weight times its volatility is the same, so the rule is simple:
The catch is that a bond-heavy portfolio has low volatility and, usually, low returns. Professional risk parity funds solve this with leverage: they borrow, typically through Treasury futures, to scale the whole balanced portfolio up to the risk level of a 60/40 or a stock portfolio. The theory is that a better-balanced portfolio earns more return per unit of risk, so scaling it up should beat 60/40 at the same risk.
| Portfolio | Annual return | Sharpe ratio | Worst drop | 2022 |
|---|---|---|---|---|
| Risk parity | 8.1% | 0.46 | −18.8% | −16.7% |
| Risk parity, leveraged | 9.2% | 0.46 | −29.9% | −27.5% |
| Risk parity, long Treasuries | 9.1% | 0.47 | −26.5% | −24.1% |
| Fixed 35/65 | 8.1% | 0.46 | −19.2% | −16.7% |
| 60/40 | 9.4% | 0.50 | −29.4% | −17.1% |
| 100% stocks | 11.0% | 0.47 | −50.9% | −18.1% |
| 10-year Treasuries | 6.1% | 0.21 | −26.6% | −16.4% |
| 3-month T-bills | 4.6% | 0.00 | 0.0% | 1.8% |
January 1973 to September 2026, total return before fees and taxes, rebalanced monthly. Risk parity = stocks and 10-year Treasuries at equal risk; leveraged version scaled to 60/40 risk, borrowing at the T-bill rate. Sharpe ratio = return above T-bills per unit of volatility. Worst drop = largest fall from a previous month-end high.
$100 invested in the unleveraged risk parity portfolio in January 1973 grew to $6,678 by September 2026. The same $100 grew to $12,539 in 60/40 and $27,823 in stocks alone. After inflation, risk parity earned 4.0% a year against 5.3% for 60/40.
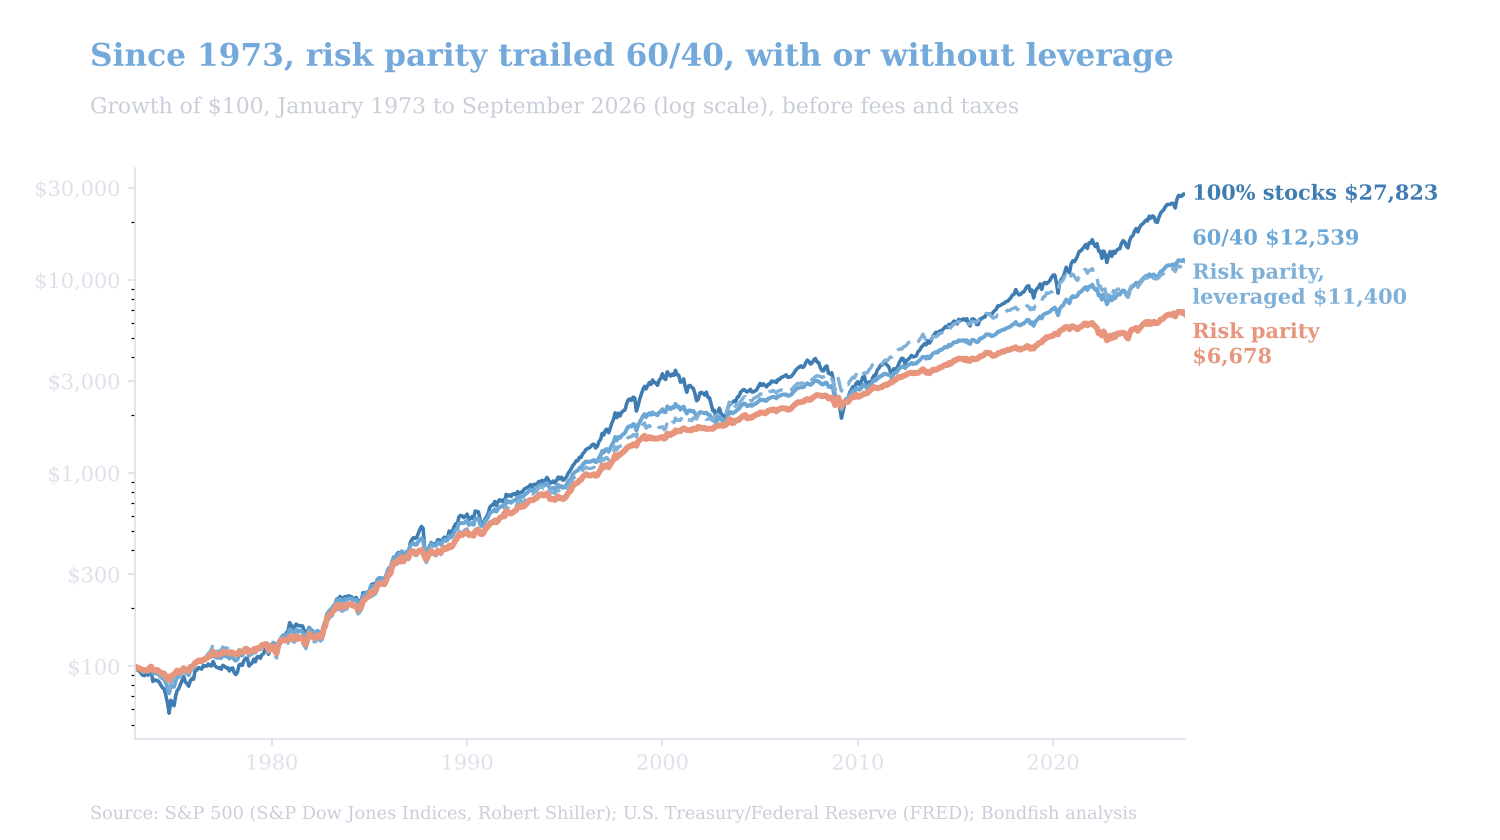
Growth of $100, January 1973 to September 2026, total return before fees and taxes, rebalanced monthly. Risk parity = stocks and 10-year Treasuries at equal risk; the leveraged version is scaled to 60/40’s volatility, borrowing at the T-bill rate. Source: S&P 500 (S&P Dow Jones Indices, Robert Shiller); U.S. Treasury/Federal Reserve (FRED); Bondfish analysis.
The unleveraged version did what it promised on risk. Its volatility was 7.8% a year against 10.0% for 60/40, it lost money in 8 of 53 calendar years against 10, and its deepest fall was 18.8%, against 29.4% for 60/40 in 2007–2009. But it gave up 1.3 percentage points of return a year, slightly more than its lower risk justified, which is why its Sharpe ratio came out a little below 60/40’s.
Leverage did not change that. The leveraged version ran at roughly 60/40’s risk (volatility of 10.5% a year) and still returned 9.2% a year against 9.4%, with a slightly deeper worst fall (29.9% against 29.4%). Its Sharpe ratio, 0.46, was essentially the unleveraged portfolio’s: borrowing at the T-bill rate magnifies both the return above cash and the volatility, so the ratio between them barely moves. Leverage cannot create a better trade-off, only amplify the one you have.
The full-period average hides three very different regimes. Risk parity bets heavily on bonds, so it thrives when bonds rally and hedge stocks, and struggles when inflation hits both.
| Period | Risk parity | Levered | 60/40 | 100% stocks |
|---|---|---|---|---|
| 1973–1981 | 4.1% | 3.6% | 4.8% | 5.0% |
| 1982–2020 | 9.9% | 11.8% | 10.8% | 11.9% |
| 2021–Sep 2026 | 2.5% | 1.0% | 7.5% | 14.8% |
| Full period | 8.1% | 9.2% | 9.4% | 11.0% |
Annual return before fees and taxes in each period. Levered = risk parity scaled to 60/40’s volatility, borrowing at the T-bill rate.
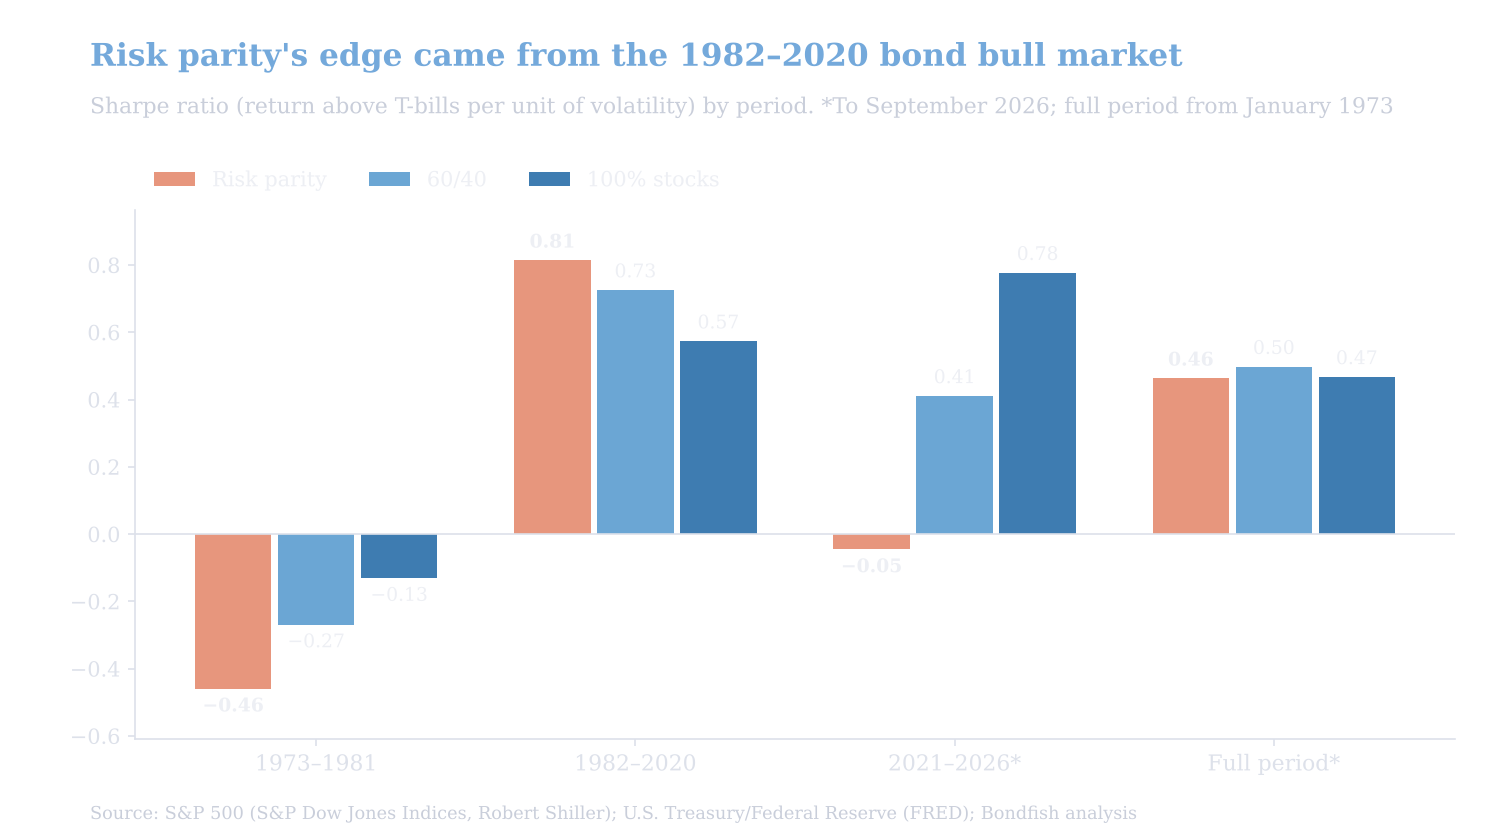
Sharpe ratio (return above 3-month T-bills divided by volatility) in each period; 2021–2026 and the full period run to September 2026. Source: S&P 500 (S&P Dow Jones Indices, Robert Shiller); U.S. Treasury/Federal Reserve (FRED); Bondfish analysis.
Because the weights follow past volatility, risk parity’s mix changes a lot over time. Its stock share ranged from 19% in early 1975, after the 1973–74 crash made stocks look dangerous, to 51% in 2006, when stocks were as calm as bonds. On average it held 35% stocks.
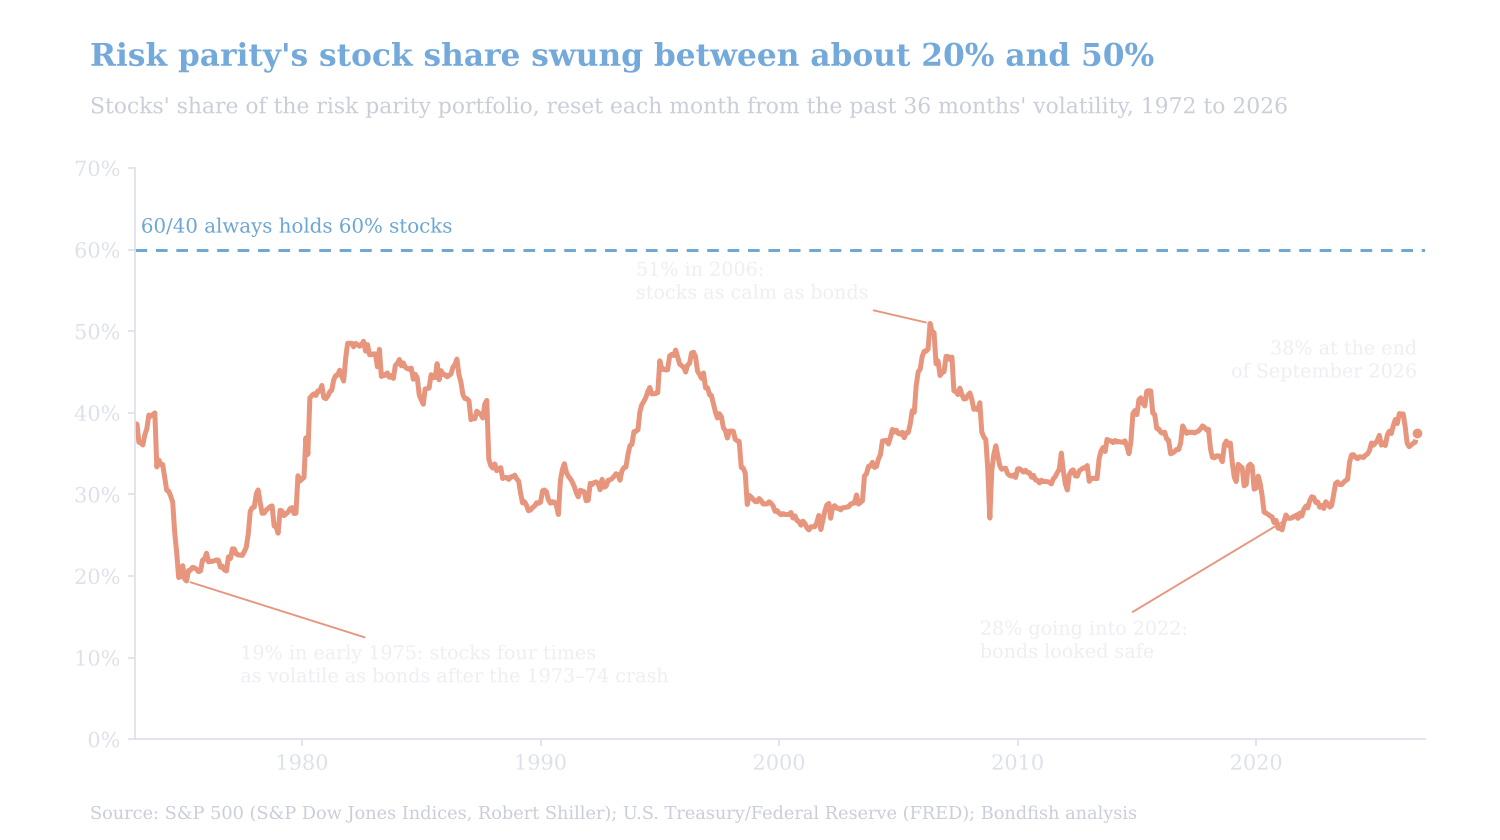
Stock share of the risk parity portfolio, reset at each month-end from the previous 36 months’ volatility of stocks and 10-year Treasuries. Source: S&P 500 (S&P Dow Jones Indices, Robert Shiller); U.S. Treasury/Federal Reserve (FRED); Bondfish analysis.
That backward-looking rule was the problem in 2022. At the end of 2021, stocks had swung 17.4% a year over the previous three years, inflated by the 2020 crash, while 10-year Treasuries had swung only 6.8% and had moved opposite to stocks (correlation −0.41). So the formula went into 2022 holding just 28% stocks and 72% bonds, right before 10-year Treasuries’ worst year in our data, a 16.4% loss. The formula measures how risky an asset has been, not how risky it is about to be. Rising inflation and interest rates hurt bonds and stocks at the same time, as we explain in why bonds are affected by inflation.
The leveraged version was hit hardest. Bond volatility had been so low that, to reach 60/40’s risk, it entered 2022 at 1.8 times leverage: about 51 in stocks and 130 in bonds for every 100 of capital. It lost 27.5% in 2022, fell 29.9% from its December 2021 peak and did not regain it until February 2026, more than four years later. The 60/40 portfolio, at the same starting risk, was back at its high by February 2024.
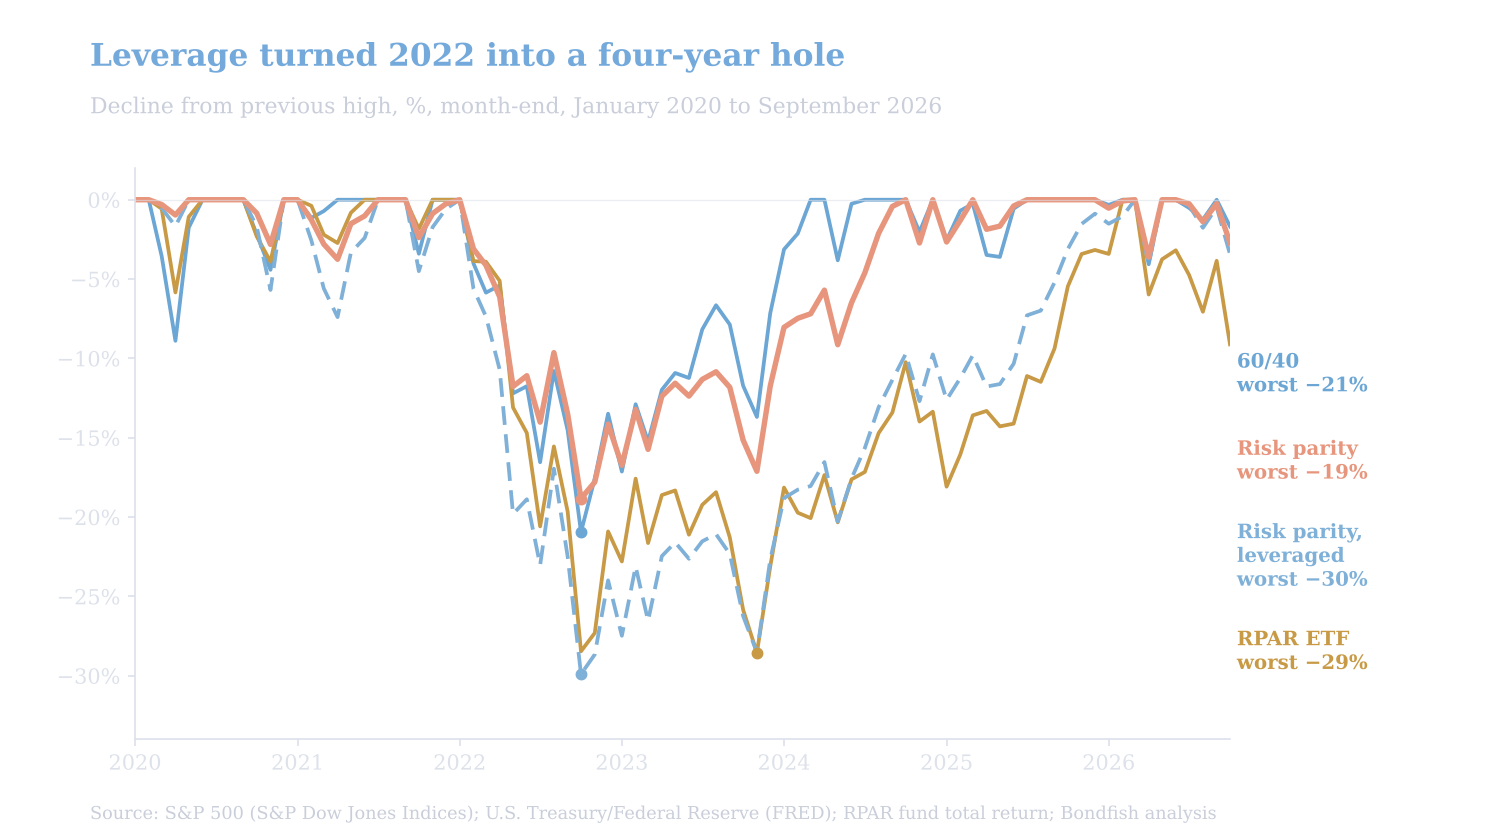
Decline from the previous month-end high, January 2020 to September 2026. RPAR returns are after the fund’s fees; the backtests are before fees and taxes. Source: S&P 500 (S&P Dow Jones Indices); U.S. Treasury/Federal Reserve (FRED); RPAR fund total return; Bondfish analysis.
Our leveraged backtest also flatters reality by borrowing at the T-bill rate. Retail investors who lever up with a margin loan usually pay more. At the T-bill rate plus half a percentage point, the leveraged version’s return falls to 9.0% a year; at plus 1.5 points it falls to 8.6%, with a Sharpe ratio of 0.41. That is still above the unleveraged 8.1%, but well below 60/40’s 9.4% at the same volatility.
The ETFs are not two-asset portfolios. RPAR’s long-term target is 25% global stocks, 35% inflation-protected Treasuries (TIPS), 25% commodities (gold and commodity producers’ shares) and 15% Treasuries, with Treasury futures on top, so its total exposure exceeds its assets. UPAR targets 1.4 times RPAR’s exposures, or 160% to 180% of its assets. Their net expense ratios were 0.51% and 0.65% a year in their 2025 prospectuses. Still, they are the real-world test of the leveraged idea, and unlike our backtest, their returns are after fees.
| Portfolio | Annual return | Worst drop | 2022 | $100 became |
|---|---|---|---|---|
| RPAR Risk Parity ETF | 3.2% | −28.6% | −22.8% | $124 |
| Risk parity (backtest) | 3.9% | −18.8% | −16.7% | $130 |
| Risk parity, leveraged (backtest) | 4.0% | −29.9% | −27.5% | $131 |
| 60/40 (backtest) | 8.8% | −20.9% | −17.1% | $177 |
| 100% stocks (backtest) | 15.3% | −23.9% | −18.1% | $262 |
January 2020 to September 2026, month-end. RPAR returns are after the fund’s fees; the other rows are this article’s backtests, before fees and taxes.
From January 2020 to September 2026, RPAR returned 3.2% a year after fees, a little below our leveraged backtest (4.0%) and far behind 60/40 (8.8%). It lost 22.8% in 2022 and fell 28.6% from December 2021 to October 2023. It regained that high only in January 2026 and ended September 9.1% below its February 2026 peak. UPAR fared worse: from its first close in our data, on January 4, 2022, it lost 30.3% by the end of 2022 and was still down 11.4% at the end of September 2026. ALLW, launched in March 2025, is too young to judge.
For a retail investor who doesn’t borrow, the most practical finding is that the moving weights added almost nothing. A plain portfolio of 35% stocks and 65% 10-year Treasuries, reset every month, returned 8.1% a year from 1973 to 2026, the same as risk parity, with the same Sharpe ratio (0.46) and a similar worst fall (19.2%). Unleveraged risk parity is, in effect, a conservative stock-bond mix with about a third in stocks.
The long-bond version is the other no-borrowing route. Long Treasuries are more volatile, so the formula holds more stocks (about 45% on average) and the portfolio ends up with roughly 60/40’s volatility (10.0% a year). It returned 9.1% a year, still below 60/40, and it was hit harder in 2022 (−24.1%) because long bonds fell 28.8%. Using longer bonds swaps borrowing risk for more interest rate risk, so it is not a free lunch either. If your real goal is simply a calmer portfolio, our guide on how to lower your overall portfolio risk covers the other tools.
Two things have changed since the risk parity heyday. First, bonds pay again: on September 30, 2026, the 10-year Treasury yielded 5.29% and 3-month bills 4.20%, according to the U.S. Treasury. In our data, the 10-year yield had not ended a month that high since March 2002. A higher starting yield gives the bond side more income to absorb losses. Second, bonds no longer reliably hedge stocks: the three-year stock-bond correlation stood at +0.43 at the end of September. In September alone, the 10-year yield rose about half a percentage point and our 10-year Treasury series lost 3.7%, dragging risk parity down 2.5% for the month.
A risk parity portfolio tends to suit you if:
You can build the bond side yourself with individual Treasuries or government bonds in your own currency; you can screen government bonds by maturity and yield to find issues that match the duration you want.
Risk parity delivers what it says on the label: balanced risk and a smoother ride. Without leverage, a stocks-and-Treasuries version returned 8.1% a year from 1973 to 2026 with 7.8% volatility, but it did not earn more per unit of risk than a plain 60/40 portfolio (0.46 against 0.50), and a fixed 35/65 mix did just as well. Its advantage was real only in the 1982–2020 bond bull market. Leverage scales the strategy up but cannot fix that, and 2022 showed how deep the hole gets when bonds and stocks fall together.
Stocks: S&P 500 total return, month-end, using S&P 500 index levels with Robert Shiller’s dividend data before October 1989. Treasury yields and T-bill rates: U.S. Treasury and Federal Reserve (FRED). Inflation: U.S. Bureau of Labor Statistics CPI-U. ETF comparison: total-return histories of RPAR and UPAR (month-end; before October 2021 RPAR uses the last weekly close of each month). Fund allocations and fees: the funds’ SEC filings. Portfolio, bond, risk parity weight and leverage results are Bondfish’s own calculation.
This article is for general information only and is not investment advice. Investing involves risk, including possible loss of principal. Leverage can magnify losses. Past performance and historical backtests do not guarantee future results. Consider your own circumstances or consult a licensed financial professional before investing.