

In the bond barbell vs bullet vs ladder comparison, the bullet came out slightly ahead: held at the same duration from 1977 to September 2026, a single Treasury note of about five years returned 6.12% a year, a 1–10 year ladder 5.97%, a 2- and 10-year barbell 5.94% and a barbell of T-bills and 30-year bonds 5.49%. The bullet won because it usually offers the most yield for its risk. The T-bill barbell gave the smoothest ride and beat the bullet in 12 of 13 years when the yield curve clearly flattened, but in none of the 16 years when it clearly steepened.
Ask how to hold bonds and you will hear three answers. Put everything in one maturity: a bullet. Spread the money evenly across maturities: a ladder. Or split it between very short and very long bonds and leave out the middle: a barbell. With 3-month T-bills paying 4.25% and 30-year Treasuries 5.42% on October 21, the cash-plus-long-bonds barbell is an easy portfolio to build.
Comparing the three is usually unfair, because they rarely carry the same risk. A portfolio of 30-year bonds swings far more than a ladder of short notes, so it will win big in some years and lose big in others for reasons that have nothing to do with its shape. We removed that difference. All four portfolios below held the same average duration, about 4.1 years, so what is left is the effect of the structure itself.
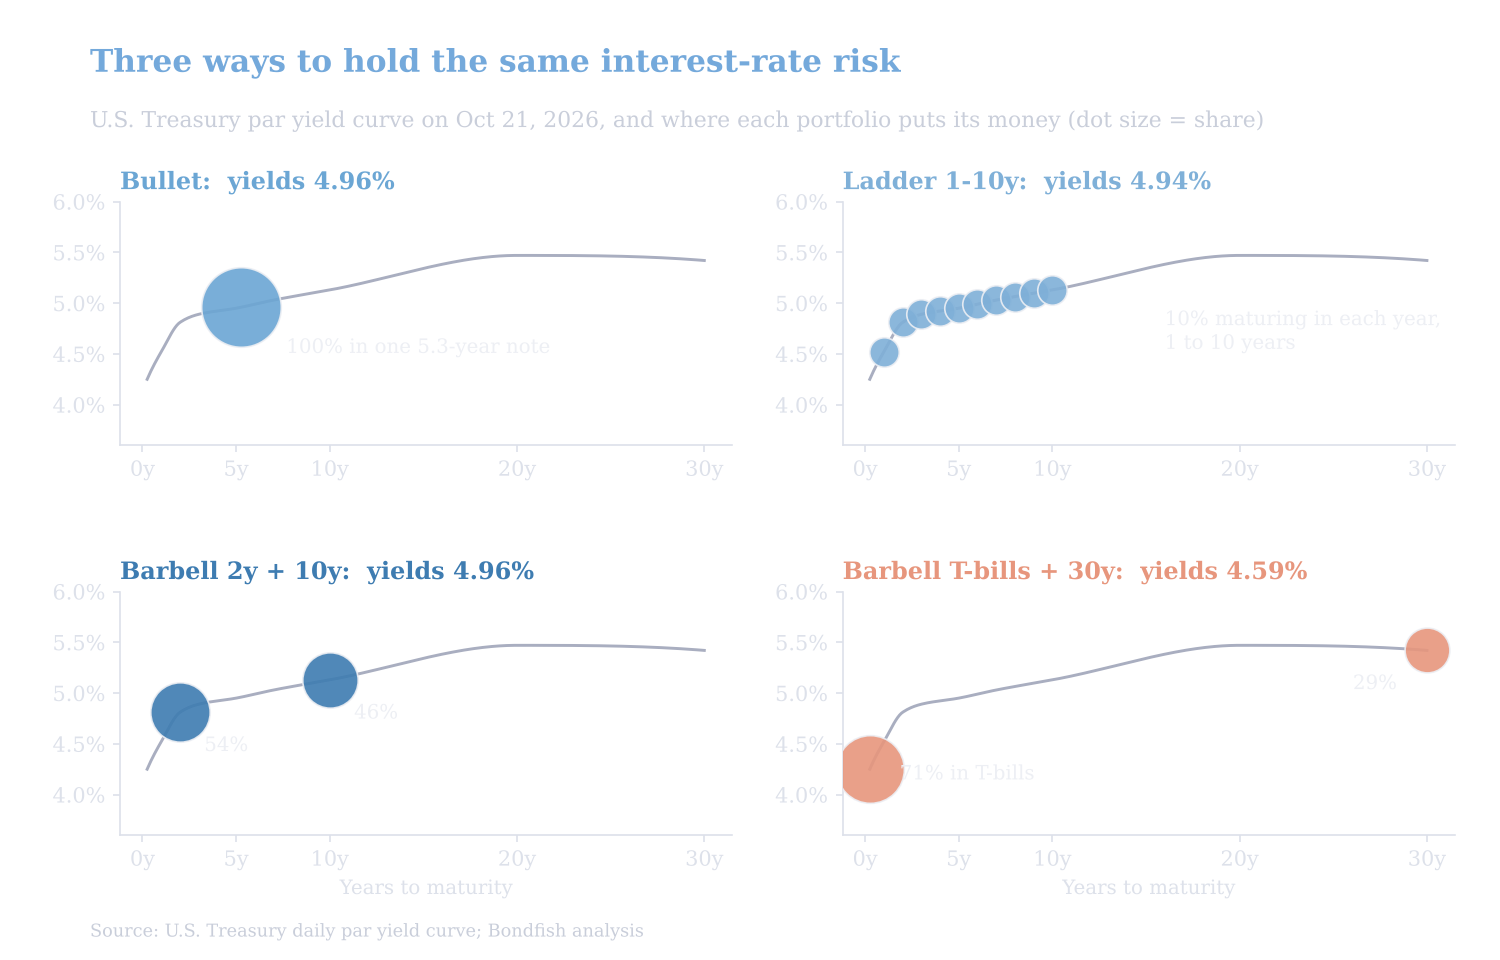
Where each portfolio holds its money on the U.S. Treasury par yield curve of October 21, 2026, and the yield each one earns. Source: U.S. Treasury; Bondfish analysis.
What ties them together is duration, the measure of how much a bond’s price moves when interest rates change (our explainer on modified duration covers the math). A barbell can match a bullet’s duration by mixing very short and very long bonds in the right proportion. What it usually cannot match is the yield: on October 21, the T-bill barbell yielded 4.59%, against 4.96% for the bullet.
As a reality check, the same method applied to 20–30 year Treasuries tracked the iShares 20+ Year Treasury Bond ETF (TLT) with a monthly correlation of 0.99 from 2002 to 2026, and earned 0.22 percentage points a year more than the fund, close to its 0.15% annual fee.
| Portfolio | Annual return | $100 became | Worst year | Worst drop |
|---|---|---|---|---|
| Bullet (one ~5-year note) | 6.12% | $1,902 | −9.0% | −12.8% |
| Ladder, 1 to 10 years | 5.97% | $1,775 | −8.3% | −12.1% |
| Barbell, 2 + 10 years | 5.94% | $1,746 | −8.2% | −11.7% |
| Barbell, T‑bills + 30 years | 5.49% | $1,412 | −7.9% | −9.3% |
| 3-month T‑bills | 4.39% | $840 | 0.0% | 0.0% |
U.S. Treasuries, February 1977 to September 2026, total return before costs and taxes. All four bond portfolios held the same average duration. Worst year = worst calendar year 1978–2025; worst drop = largest fall from a previous high.
The bullet finished first and the T-bill barbell last, 0.63 percentage points a year apart. Over 49 years that turned $100 into $1,902 in the bullet and $1,412 in the T-bill barbell. The ladder and the 2/10 barbell landed in between, within 0.2 points a year of the bullet.
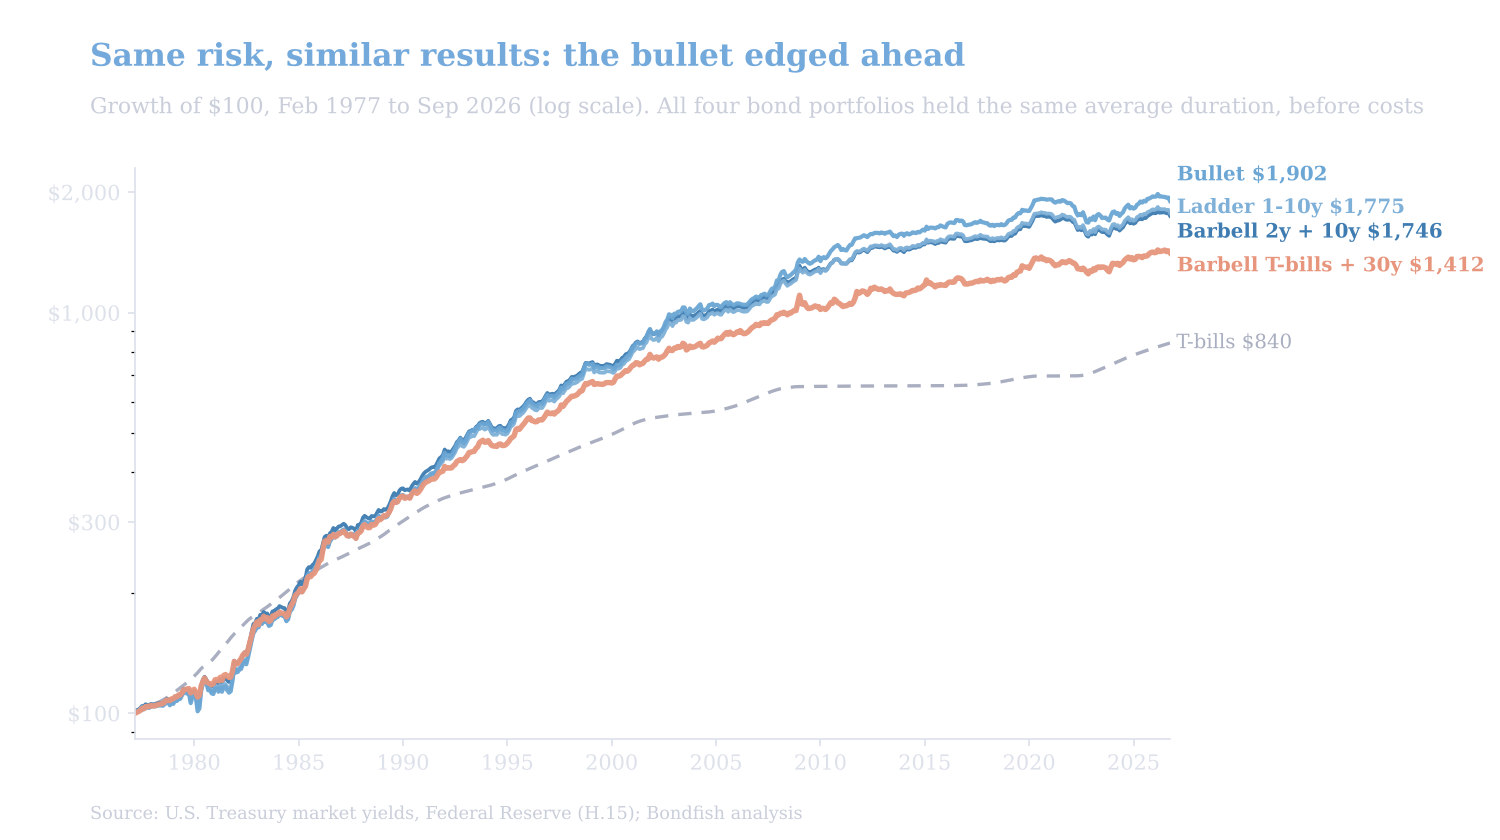
Growth of $100 in U.S. Treasuries, February 1977 to September 2026, total return before costs and taxes. All four bond portfolios held the same average duration. Source: U.S. Treasury market yields, Federal Reserve (H.15); Bondfish analysis.
Risk ran the other way. The T-bill barbell had the lowest volatility, 4.2% a year against 5.3% for the bullet, and the smallest fall from the July 2020 peak to the October 2022 low: 9.3% against 12.8% for the bullet. It also regained its old high first, in February 2025, seven months before the bullet and the ladder. The reason is that long-term yields tend to move less than medium-term ones. Since 1977, the 30-year yield’s annualized volatility has been 1.04 percentage points, against 1.36 for the 5-year, so the same duration placed at the long end carried less day-to-day risk.
The ranking matched the ranking of yields. Averaged over every month since 1977, the bullet had the highest yield. The ladder yielded 0.06 points less, the 2/10 barbell 0.10 points less and the T-bill barbell 0.44 points less. The return gaps to the bullet were a little wider still: 0.15, 0.18 and 0.63 points a year.
The T-bill barbell’s shortfall comes from the shape of the yield curve. To match the bullet’s duration it kept on average 69% of its money in bills, which usually pay the least. Since 1977, 5-year notes have yielded on average 1.05 points more than 3-month bills, while 30-year bonds have yielded only 0.78 points more than 5-year notes. The yield lost on the bills was larger than the yield gained on the 30-year slice.
What the barbell gets in exchange is more convexity: a bigger price gain when yields fall and a smaller loss when they rise, an edge that grows with the size of the move. The CFA Institute’s curriculum notes that a barbell has greater convexity than a bullet of the same duration. Ours averaged about 89 against 21 for the bullet. But convexity only pays off on large moves in rates, while the lower yield is a cost every year. Over 49 years, convexity and changes in the curve did not win back any of the yield the barbell gave up.
Year to year, the gap between the structures was driven by changes in the shape of the yield curve, measured here as the 30-year yield minus the 5-year yield.
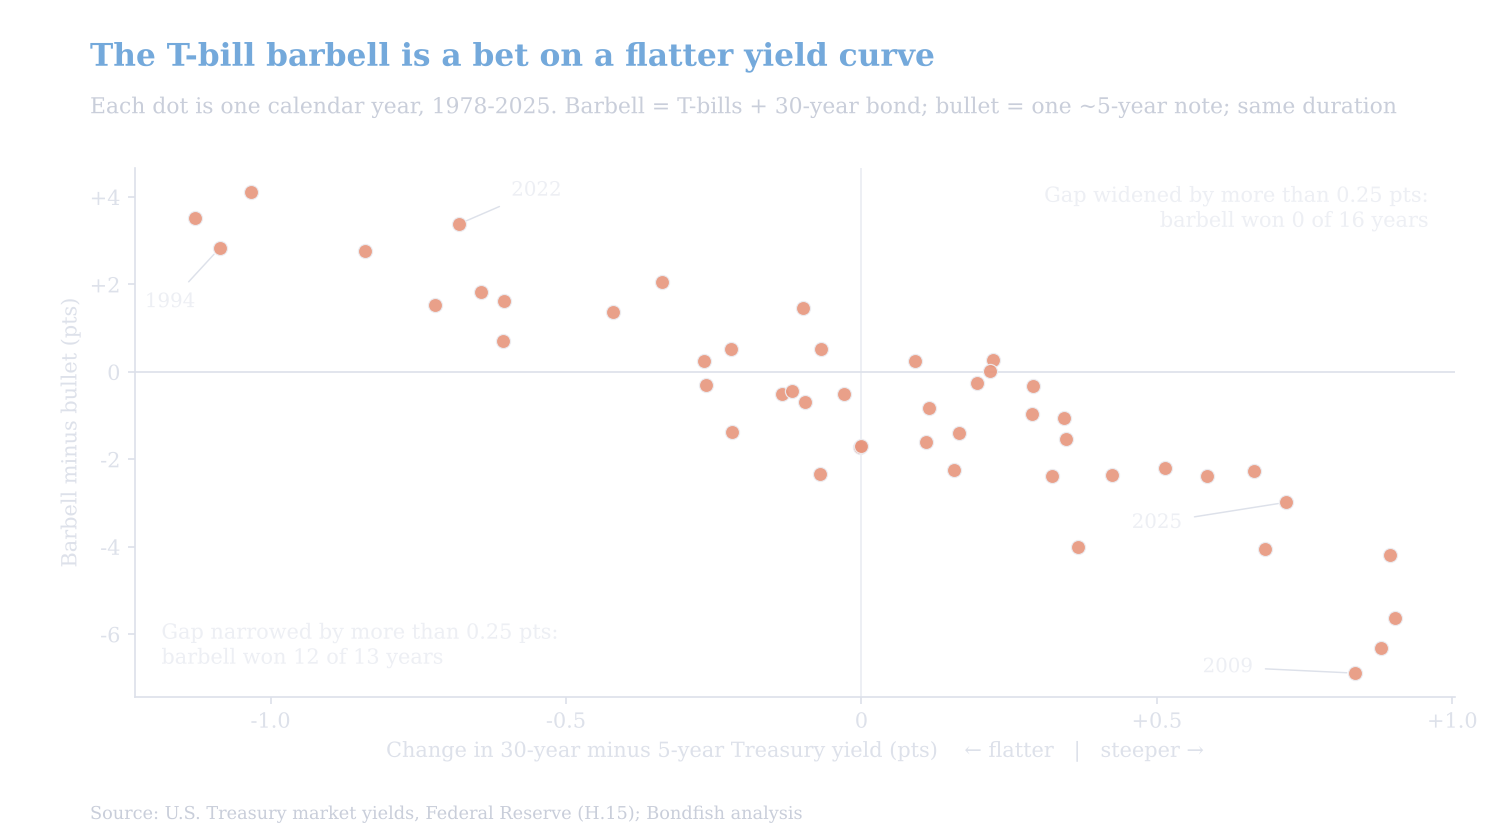
T-bill and 30-year barbell return minus bullet return in each calendar year, 1978 to 2025, against the change in the 30-year minus 5-year Treasury yield gap. Source: U.S. Treasury market yields, Federal Reserve (H.15); Bondfish analysis.
The 2/10 barbell followed the same pattern on a smaller scale: it beat the bullet in 10 of 13 flattening years and 2 of 16 steepening years. In other words, choosing a barbell over a bullet is a bet that long-term yields will fall relative to medium-term yields.
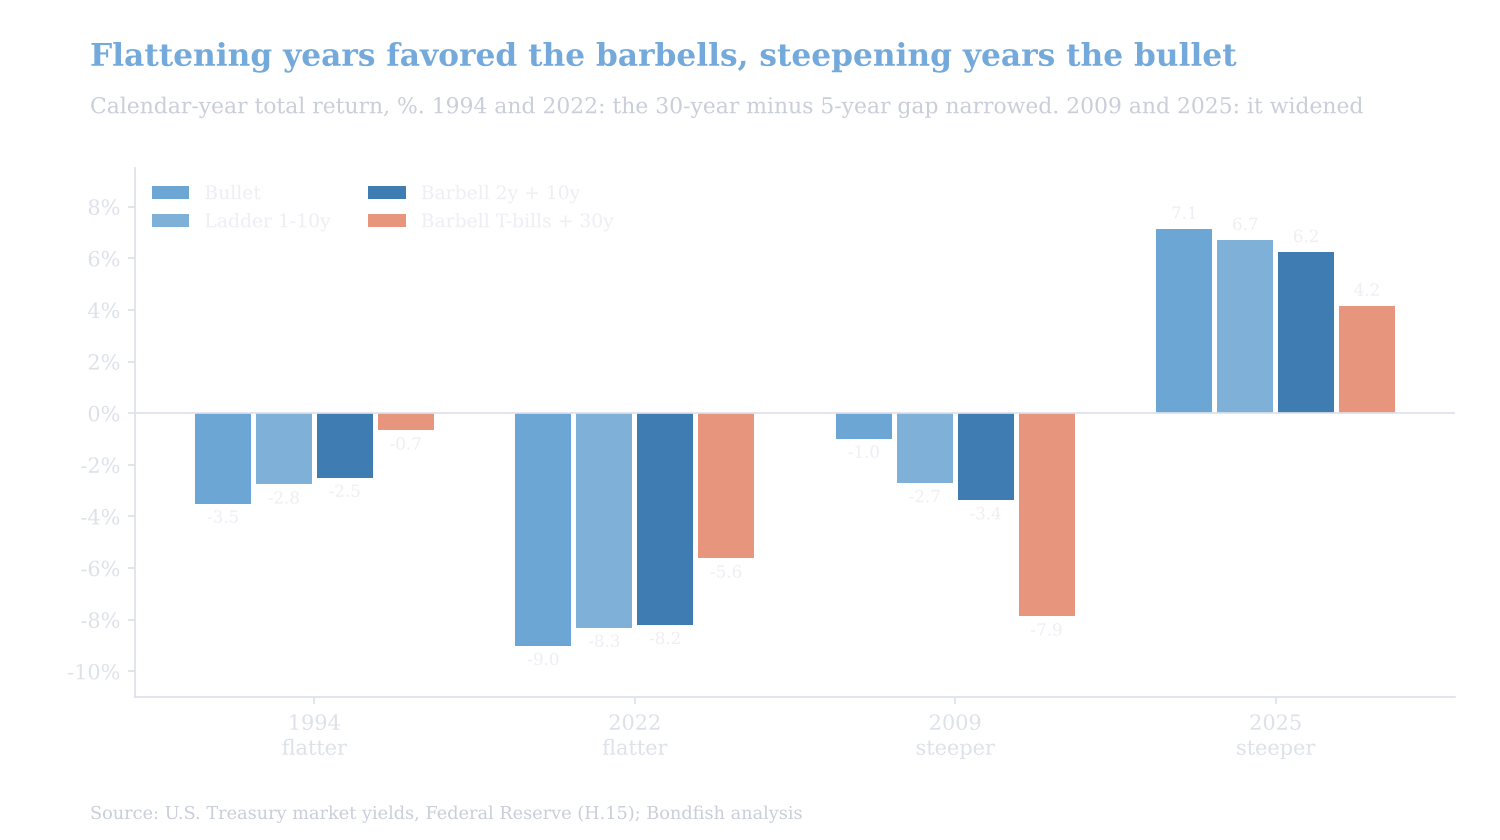
Calendar-year total returns in two flattening years (1994, 2022) and two steepening years (2009, 2025). Source: U.S. Treasury market yields, Federal Reserve (H.15); Bondfish analysis.
The clearest examples are recent. In 2022, 3-month bill yields jumped 4.3 points while the 30-year rose less than the 5-year, and the T-bill barbell lost 5.6% against 9.0% for the bullet. In 2009, as markets recovered from the financial crisis, bill yields stayed near zero while the 30-year yield rose 2.0 points: the barbell lost 7.9% and the bullet only 1.0%. That was the T-bill barbell’s worst calendar year, worse even than 2022.
Curve moves also explain the long eras. Rate-hiking cycles usually flatten the curve, and a barbell’s bills reinvest quickly at the higher rates. So both barbells did better than the bullet while rates climbed, and worse during the four-decade fall in rates.
| Era | Bullet | Ladder | 2y + 10y | Bills + 30y |
|---|---|---|---|---|
| Rising rates: Feb 1977 to Sep 1981 | 2.8% | 3.2% | 4.1% | 4.6% |
| Falling rates: Sep 1981 to Jul 2020 | 7.6% | 7.3% | 7.1% | 6.4% |
| Rising rates: Jul 2020 to Sep 2026 | −0.2% | −0.1% | −0.1% | 0.4% |
Annual return in each interest-rate era, before costs. Eras run between the 5-year Treasury yield’s major highs and lows. 2y + 10y = barbell of 2- and 10-year notes; bills + 30y = barbell of T-bills and 30-year bonds.
A ladder holds short, medium and longer notes at once, so it behaves like a mild barbell: it beat the bullet in 12 of the 13 flattening years and lost in most steepening years. But its swings were small. In no calendar year did it trail the bullet by more than 1.7 points or beat it by more than 1.1. Of the three shapes, it is the one that bets least on the curve.
Its practical strengths have nothing to do with returns. A rung matures every year, so money comes back on a schedule without selling anything, and reinvestment happens gradually at whatever rates are on offer. A bullet needs a decision about the one maturity to own; a barbell needs a view on the curve. A ladder needs neither.
On October 21, 2026, the Treasury curve ran from 4.25% for 3-month bills to 4.95% for 5-year notes and 5.42% for 30-year bonds, with the 20-year at 5.47%. Built on that curve, the bullet would yield 4.96%, the ladder 4.94%, the 2/10 barbell 4.96% and the T-bill barbell 4.59%, 0.37 points less than the bullet. The curve has flattened a little this month: the 30-year yield fell from 5.61% on October 1, while the 5-year moved from 5.01% to 4.95%.
| If the curve… | Bullet | Ladder | 2y + 10y | Bills + 30y |
|---|---|---|---|---|
| Yields don’t change | 5.2% | 5.2% | 5.3% | 4.6% |
| All yields fall 1 point | 9.1% | 9.1% | 9.3% | 8.6% |
| All yields rise 1 point | 1.5% | 1.5% | 1.7% | 1.6% |
| All yields fall 2 points | 13.1% | 13.3% | 13.5% | 13.8% |
| All yields rise 2 points | −2.1% | −2.0% | −1.7% | −0.8% |
| Short yields fall 1 point, 30-year unchanged | 6.7% | 6.5% | 6.5% | 4.0% |
| 30-year rises 1 point, short yields unchanged | 2.9% | 2.8% | 2.8% | 0.9% |
| 30-year falls 1 point, short yields unchanged | 7.5% | 7.7% | 8.0% | 9.2% |
Estimated total return over the 12 months from October 21, 2026, before costs, if the Treasury curve shifts at once and then holds. Short yields = 3-month bill; the move fades gradually across the maturities in between.
If nothing changes, the T-bill barbell earns about 4.6% over the next year, against 5.2% for the bullet. It beats the bullet when long-term yields fall relative to short-term ones, when yields rise, or when they move about 2 points either way, which is where convexity starts to pay. It trails when the curve holds still or yields fall about a point, and most of all in a classic rate-cut pattern: short-term yields fall while long-term yields stay put. In that scenario it would return 4.0%, against 6.7% for the bullet.
Held at the same duration through 49 years of U.S. Treasury data, the bullet edged out the ladder and the 2/10 barbell, and the T-bill barbell came last, 0.63 points a year behind, because it gave up yield it never earned back through convexity. The barbell’s real character is a bet on the shape of the yield curve: it won when the curve flattened and lost when it steepened, with a smoother ride along the way. Pick duration first, a bullet for a known date, a ladder for no view, and a barbell only if you want that curve bet.
Data and method: month-end U.S. Treasury yields on 3-month bills, 1-, 2-, 3-, 5-, 7- and 10-year notes and the 30-year bond, February 1977 to September 2026, with Federal Reserve H.15 constant-maturity yields filling the months when the Treasury was not issuing a maturity. Portfolio returns are Bondfish’s own calculation: par Treasuries repriced every month from the yield curve, rebuilt once a year at the same average duration, with coupons held in T-bills between rebuilds; each portfolio averages 12 slices rebuilt in different months. Today’s yields and the 12-month scenarios use the U.S. Treasury par yield curve of October 21, 2026. No fees, trading costs or taxes. Past performance does not predict future returns.
Every return, yield and scenario in this article is Bondfish’s own calculation from public Treasury yield data. The underlying data:
This article is for general information only and is not investment advice. Bond investing involves risk, including possible loss of principal. Past performance and historical backtests do not guarantee future results; backtested results are hypothetical and exclude fees, taxes and trading costs. Consider your own circumstances or consult a licensed financial professional before investing.