
Our All-Weather portfolio backtest finds a 7.8% annual return from 1991 to 2026, less than a 60/40 portfolio’s 9.0%, but with a much shallower worst drop: -19.9% versus -30.8%. It made money through the 2000 to 2002 and 2008 stock crashes, then suffered its worst year in 2022 (-17.9%), when rising inflation hit its large position in long-term Treasuries.
The All-Weather idea comes from Ray Dalio’s Bridgewater Associates, which developed the approach in the mid-1990s to hold up in any economic climate without having to predict it. A simplified version for individual investors appeared in Tony Robbins’ 2014 book Money: Master the Game and has been widely copied since. Interest is back: a risk-parity ETF built on the same logic (RPAR) launched in 2019, and in March 2025 Bridgewater and State Street launched an All Weather ETF (ALLW) that held about $1.8 billion by the end of September 2026. So we tested the retail recipe on 35 years of monthly data, with no hindsight tweaks.
The retail All-Weather portfolio splits money five ways and is rebalanced back to these weights once a year:
The logic is about balancing risk, not dollars. Dalio’s framework sorts the economy into four “seasons”: growth rising or falling, and inflation rising or falling. Stocks tend to do best when growth surprises on the upside, Treasuries when growth and inflation fall, and gold and commodities when inflation rises. Because bonds swing far less than stocks, the portfolio holds more of them, so that a stock crash and a bond rally can roughly offset each other. That is why 55% sits in Treasuries.
We rebuilt each piece from market data, monthly, from the end of January 1991 to the end of September 2026 (428 months):
The portfolio is reset to its target weights every December. For comparison we ran a 60/40 portfolio (60% S&P 500, 40% a broad U.S. investment-grade bond index, also rebalanced yearly) and 100% stocks. Every figure is a total return (price change plus reinvested income) before fees, taxes and trading costs. After-inflation figures use U.S. consumer prices through August 2026, the latest available.
$100 invested at the start grew to $1,468 in the All-Weather portfolio, against $2,161 in a 60/40 and $4,473 in stocks alone. That works out to 7.8% a year, or 5.2% a year after inflation.
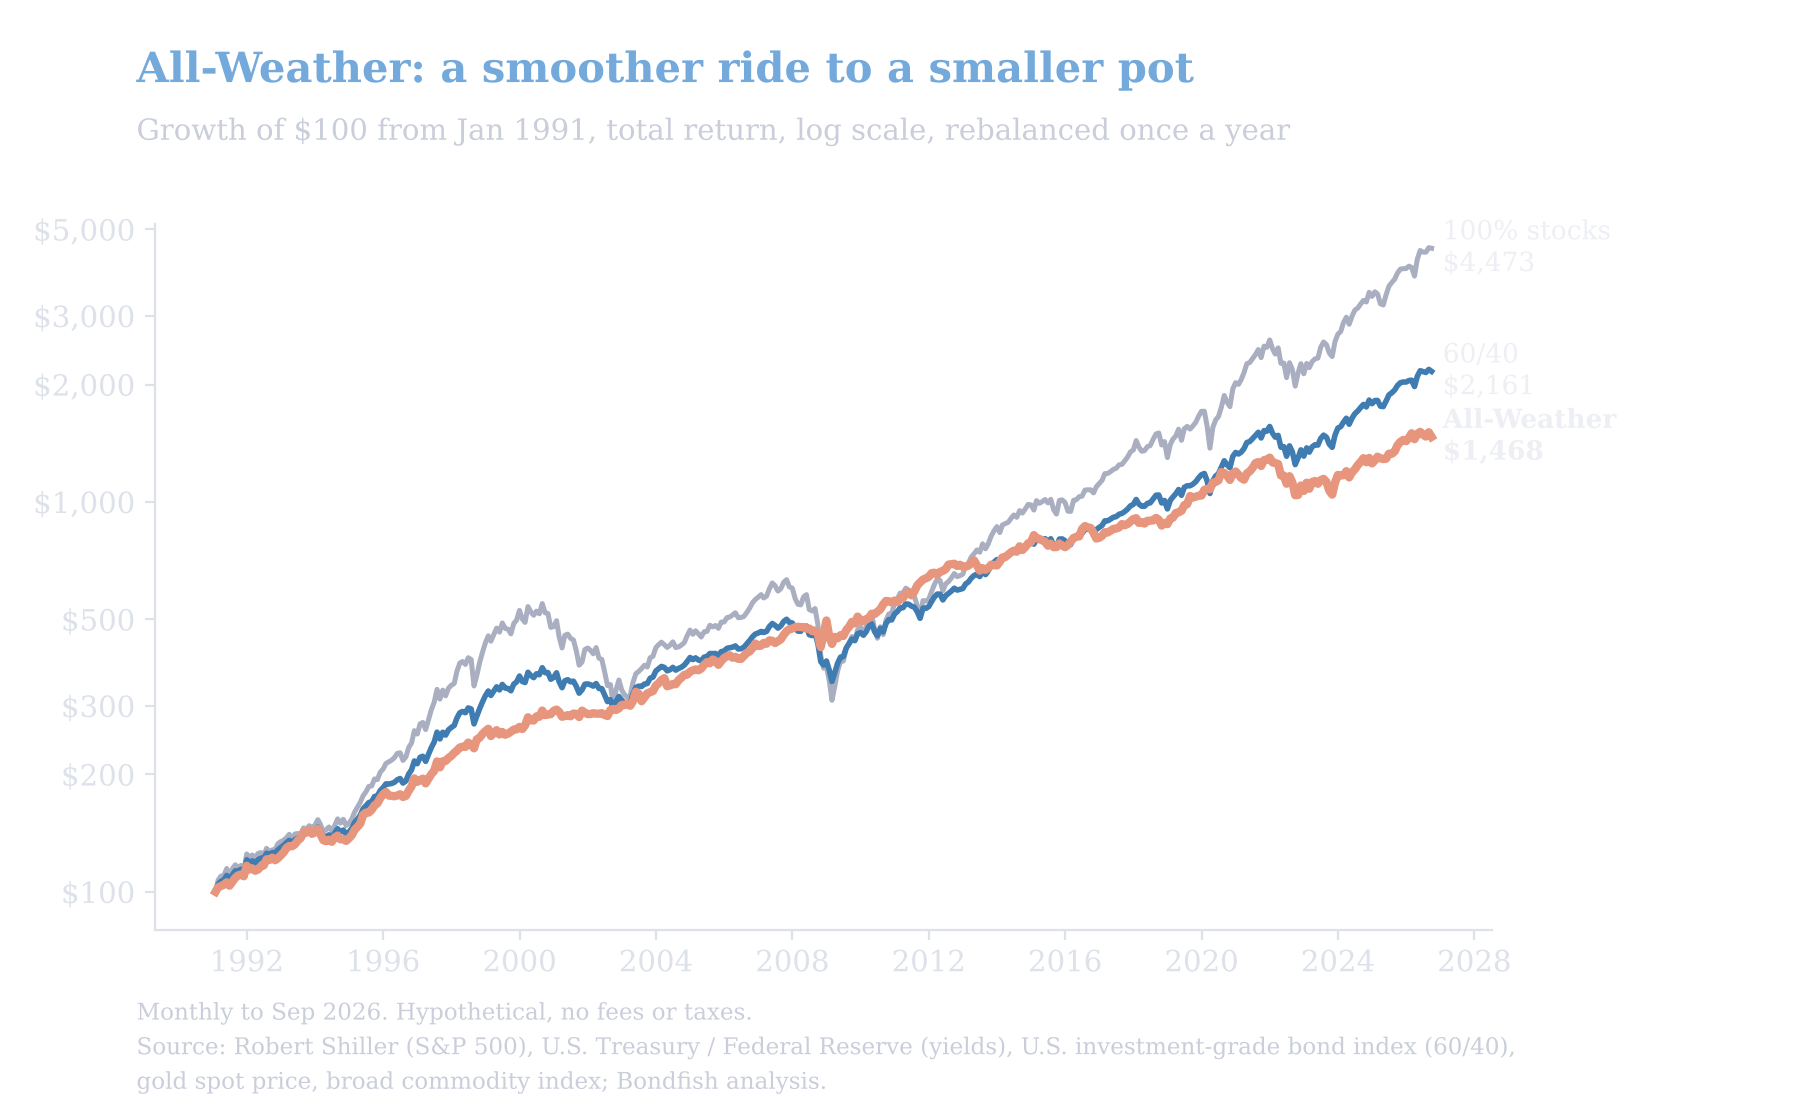
Growth of $100, January 1991 to September 2026, total return, log scale. Source: Robert Shiller (S&P 500), U.S. Treasury / Federal Reserve (yields), U.S. investment-grade bond index (60/40), gold spot price, broad commodity index; Bondfish analysis.
| Portfolio | Annual return | Worst drop | Worst year | $100 became |
|---|---|---|---|---|
| All-Weather | 7.8% | -19.9% | -17.9% (2022) | $1,468 |
| 60/40 | 9.0% | -30.8% | -20.1% (2008) | $2,161 |
| 100% stocks | 11.2% | -50.9% | -37.0% (2008) | $4,473 |
All-Weather vs 60/40 vs stocks, end of January 1991 to end of September 2026, total return, rebalanced once a year.
What you got in exchange for the lower return was a calmer ride. All-Weather’s volatility (how much returns swing from year to year) was 7.6%, against 9.1% for 60/40 and 14.6% for stocks. Its worst peak-to-trough fall was 19.9%, about two-thirds of the 60/40’s and well under half of the stock market’s. It lost money in 6 of 34 full calendar years, and five of those losses were 3.4% or smaller.
Per unit of risk, the two balanced portfolios came out roughly even. The Sharpe ratio (return above cash per unit of volatility) was 0.67 for All-Weather and 0.70 for 60/40. All-Weather did not deliver more return for the risk taken. It delivered less of both.
The strategy did exactly what it promised when stocks fell for reasons other than inflation. From 2000 to 2002, as the dot-com bubble burst, stocks lost 37.6% in total and a 60/40 lost 13.3%. All-Weather gained 13.9%. In 2008, stocks fell 37.0% and 60/40 lost 20.1%, while All-Weather rose 4.9%.
The engine both times was the 40% in long Treasuries. When growth collapses, investors pile into government bonds and the Federal Reserve cuts rates, so long bond prices jump. Our long Treasury leg returned 20.9% in 2000 and 38.8% in 2008, turning the year’s main disaster into a partial hedge.
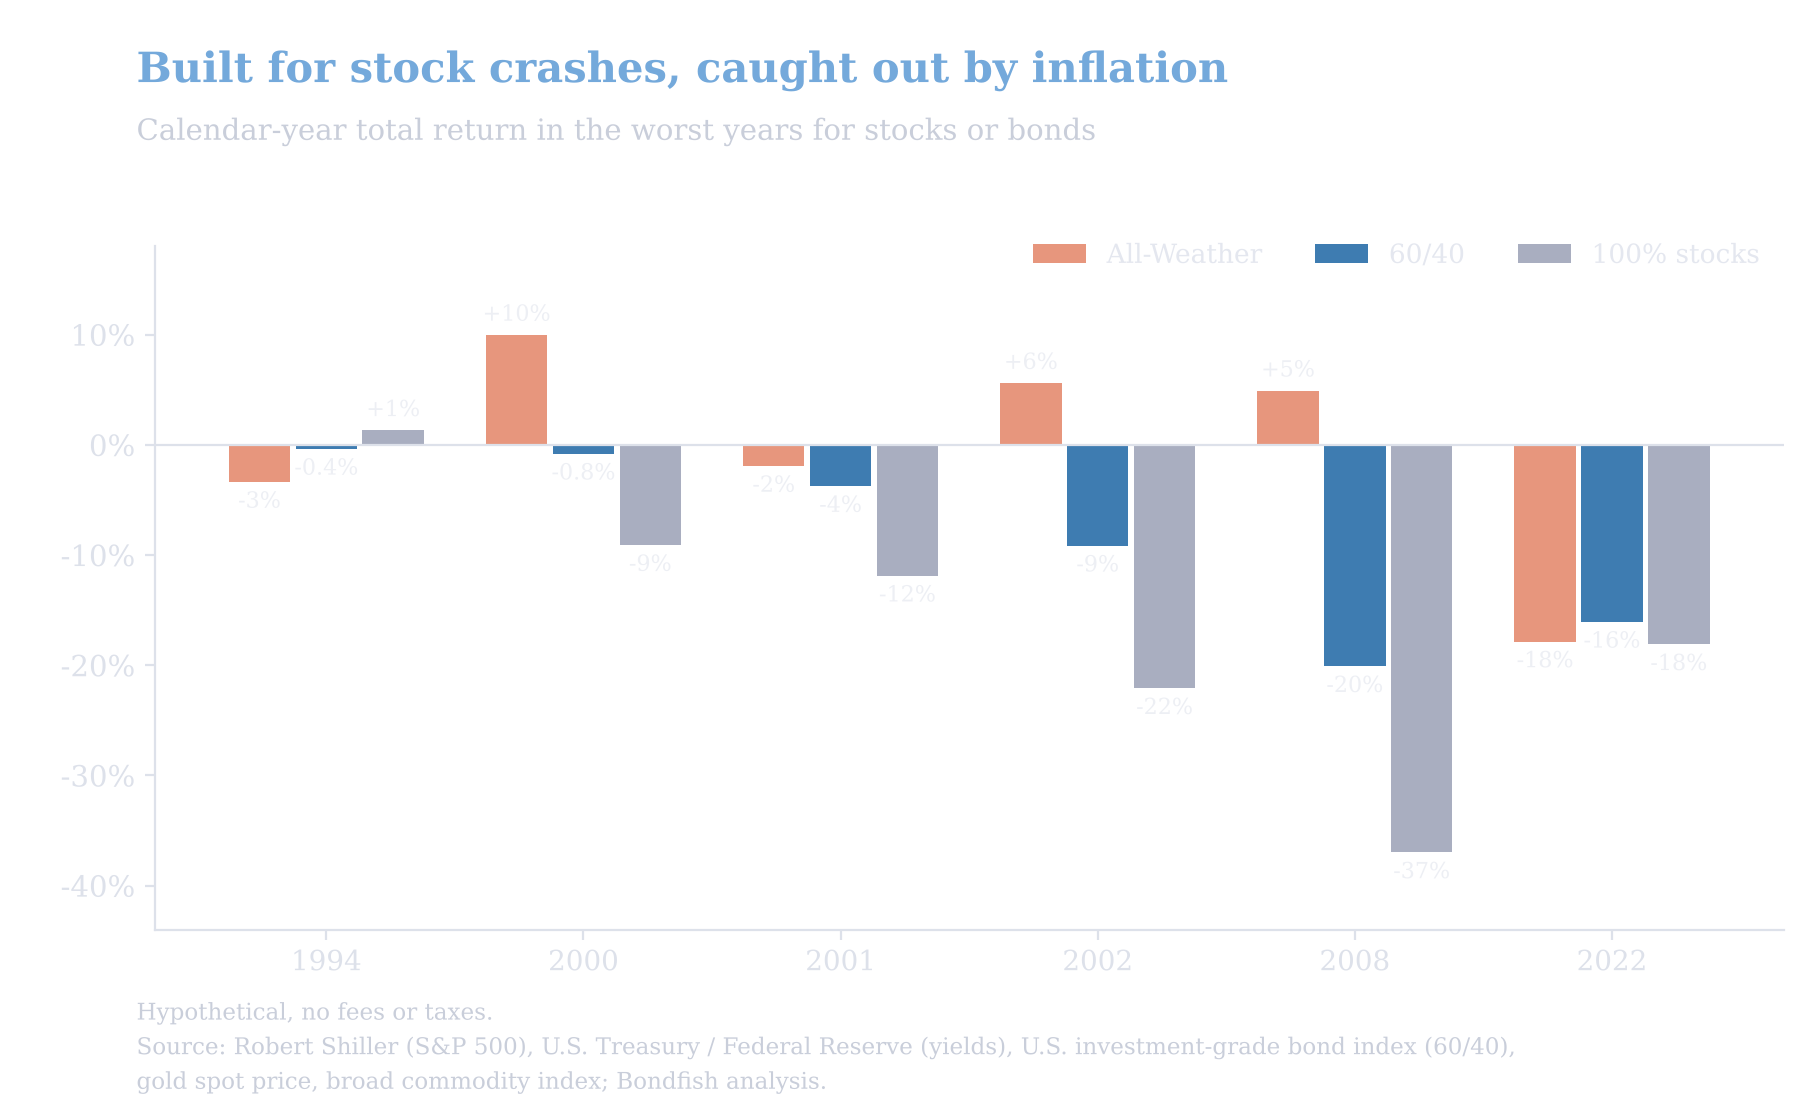
Calendar-year total return in the worst years for stocks or bonds since 1991. Source: Robert Shiller (S&P 500), U.S. Treasury / Federal Reserve (yields), U.S. investment-grade bond index (60/40), gold spot price, broad commodity index; Bondfish analysis.
That crash protection shows up over long holding periods too. All-Weather’s worst 10-year stretch in our data (October 2012 to September 2022) still earned 4.1% a year. The worst decade for a 60/40 earned 0.8% a year, and stocks alone lost 3.4% a year over theirs, both ending in February 2009.
2022 should have been All-Weather’s moment: inflation at a four-decade high and the Fed raising rates at the fastest pace since the early 1980s. Instead it delivered the portfolio’s worst year in our data, a 17.9% loss, slightly worse than the 16.1% lost by a 60/40. RPAR, the risk-parity ETF, fell 22.8% that year, according to its annual report.
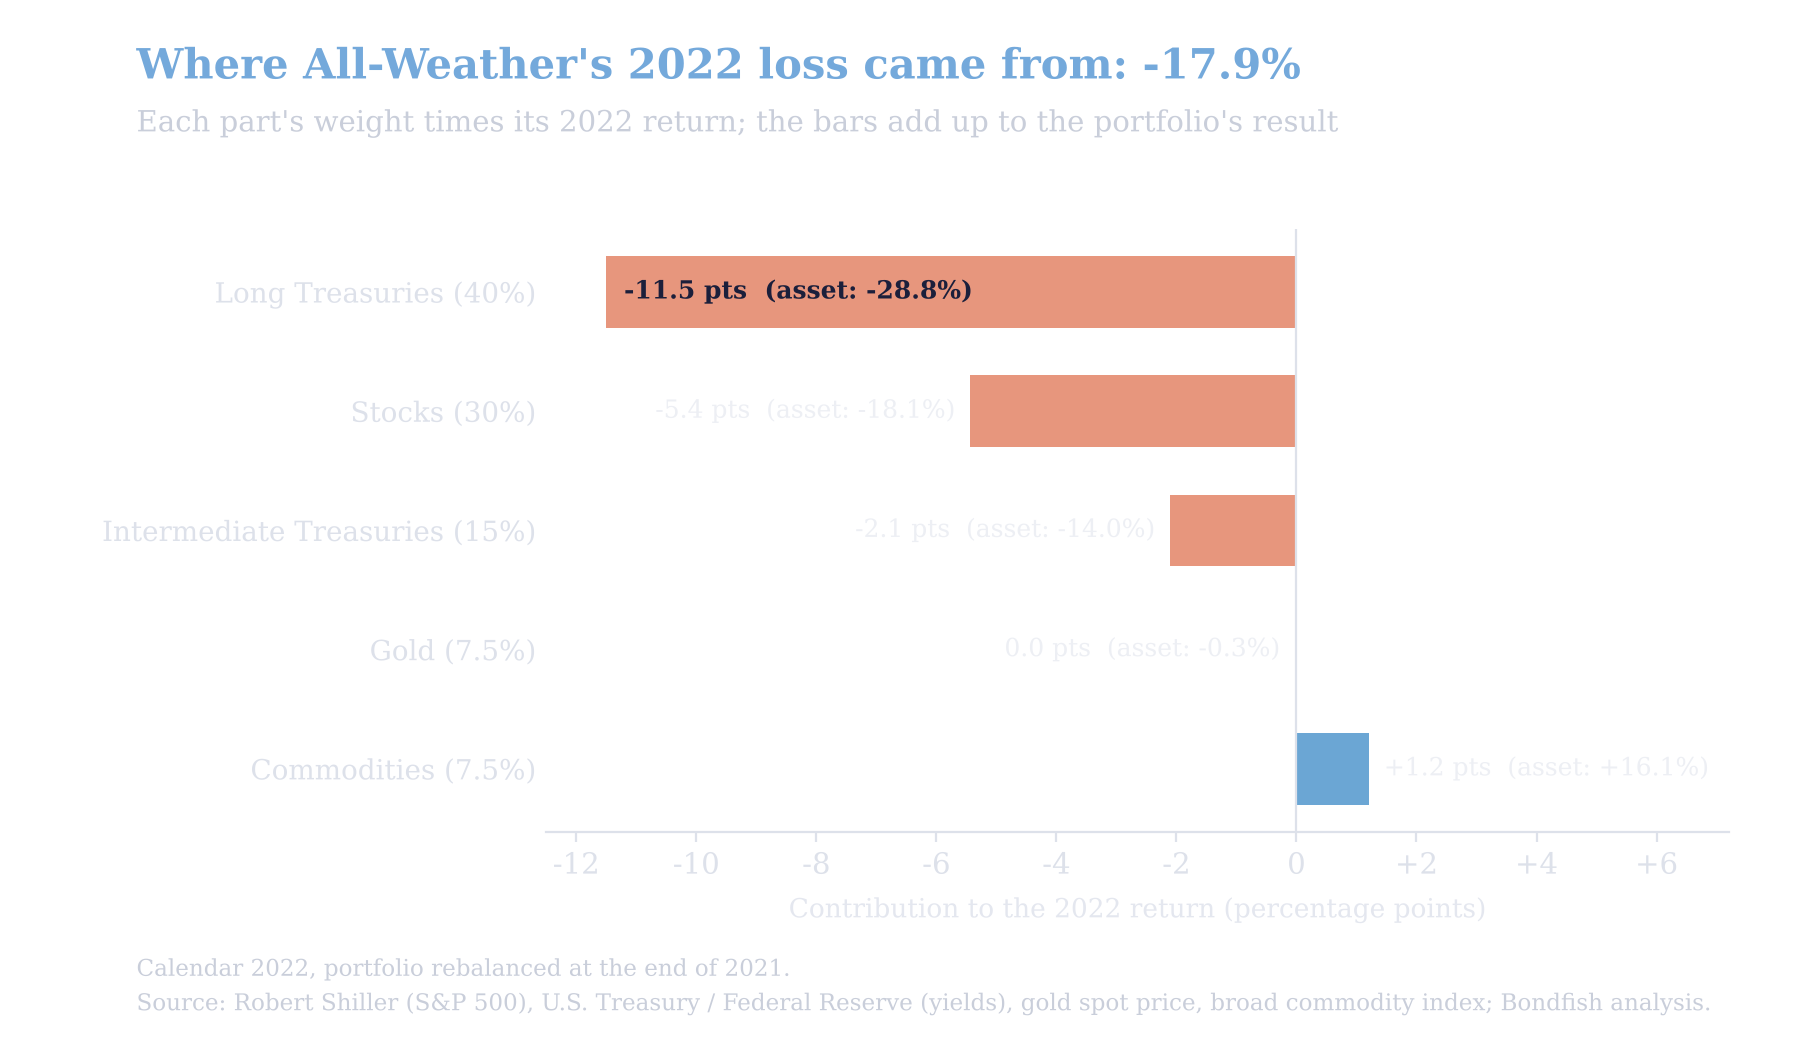
Each asset’s contribution to the 2022 return (weight times return), portfolio rebalanced at the end of 2021. Source: Robert Shiller (S&P 500), U.S. Treasury / Federal Reserve (yields), gold spot price, broad commodity index; Bondfish analysis.
The breakdown shows where the damage came from. Long Treasuries lost 28.8% and, at 40% of the portfolio, cost 11.5 percentage points on their own. Stocks cost another 5.4 points and intermediate Treasuries 2.1. Commodities did their job, rising 16.1%, but at a 7.5% weight they added back only 1.2 points. Gold, the other inflation hedge, finished flat.
The bonds fell because of duration, a bond’s sensitivity to interest rates: the longer the maturity, the bigger the price drop when yields rise (our guide to bond duration vs maturity explains the mechanics). The 30-year Treasury yield more than doubled in 2022, from 1.90% to 3.96%, and a long bond bought at a 1.9% yield had almost no income to cushion that move.
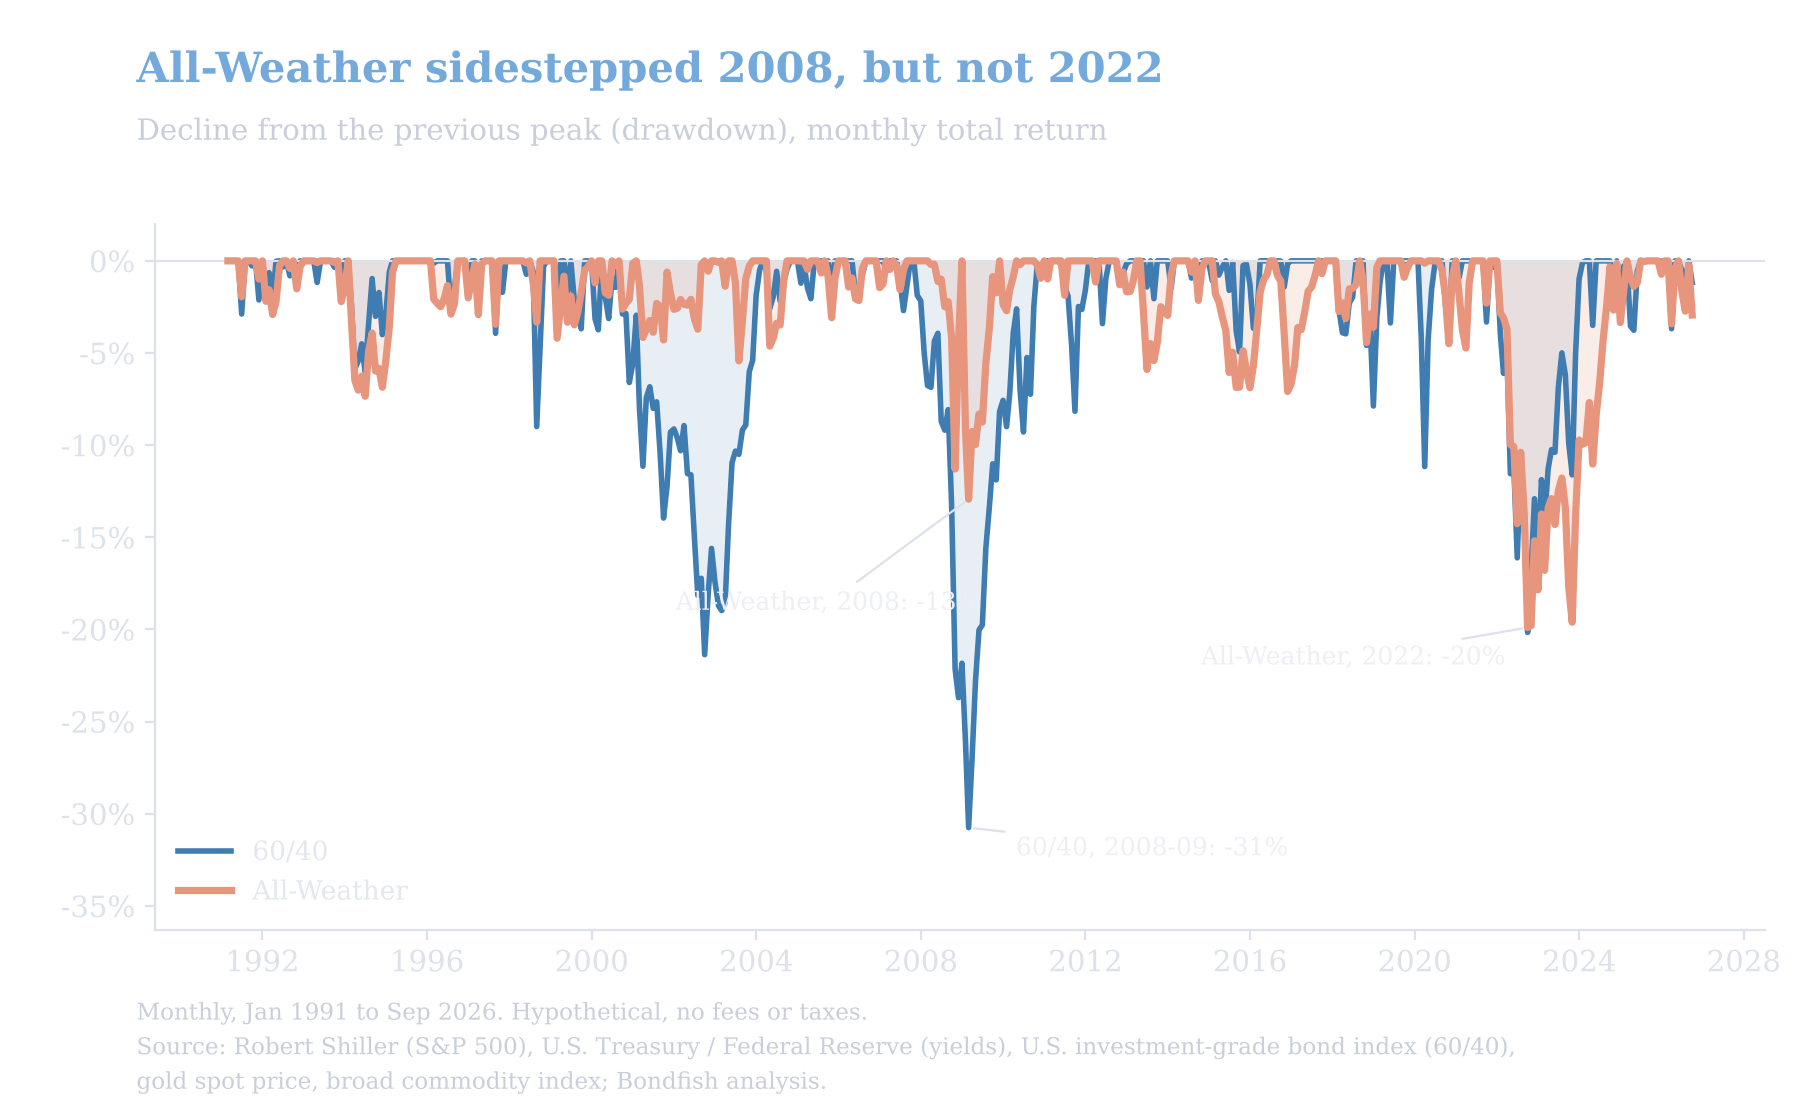
Decline from the previous peak, monthly total return. Source: Robert Shiller (S&P 500), U.S. Treasury / Federal Reserve (yields), U.S. investment-grade bond index (60/40), gold spot price, broad commodity index; Bondfish analysis.
The recovery was slow, too. From its December 2021 peak, All-Weather fell 19.9% by September 2022 and did not get back to that peak until February 2025, 38 months later. A 60/40 fell about as far (20.2%) but was back at its high by February 2024, after 26 months. Since the start of 2022, All-Weather has returned 2.6% a year, against 7.1% for the 60/40.
The word “balanced” hides how concentrated the retail version is. Measured by how much of the portfolio’s ups and downs each piece causes, long Treasuries account for about 48% of its total risk over 1991 to 2026, and Treasuries together for about 57%. Stocks account for 34%. Gold and commodities, the two pieces meant to handle rising inflation, account for only about 9%.
For most of the past 35 years that bond-heavy tilt was a gift. Yields fell for decades, and stocks and Treasuries tended to move in opposite directions: the monthly correlation between stocks and long Treasuries was -0.18 from 1991 to 2021. Since 2022 it has been +0.59, so the portfolio’s two biggest pieces have often fallen together. When inflation, not a recession, is the problem, rising yields hit stocks and bonds at the same time (see why bonds are affected by inflation changes).
The professional version is built differently. Bridgewater’s ETF uses derivatives to hold total exposures of about 190% of its assets, including roughly 41% in inflation-linked bonds and 33% in commodities, according to the fund’s website as of September 30, 2026. The simple 30/40/15/7.5/7.5 mix uses no leverage and holds no inflation-linked bonds, so its inflation protection rests on just 15% in gold and commodities.
| Asset (weight) | Annual return | In 2008 | In 2022 | Worst drop |
|---|---|---|---|---|
| Stocks (30%) | 11.2% | -37.0% | -18.1% | -50.9% |
| Long Treasuries (40%) | 5.4% | +38.8% | -28.8% | -45.1% |
| Intermediate Treasuries (15%) | 4.6% | +18.3% | -14.0% | -22.6% |
| Gold (7.5%) | 7.1% | +5.8% | -0.3% | -41.9% |
| Commodities (7.5%) | 3.9% | -35.6% | +16.1% | -72.0% |
The five building blocks, 1991 to 2026, total return. Each one has a job, and a year it fails.
The backtest does not make All-Weather a bad portfolio. It makes it a specific one. A few takeaways:
Whichever mix you choose, it helps to know how to lower your overall portfolio risk and where each piece’s risk comes from. If you build the bond slice yourself with individual Treasuries, you can filter by maturity and yield in the Bondfish bond screener.
Over 35 years, the All-Weather portfolio returned 7.8% a year, trailing a 60/40 by about 1.2 points a year but with much smaller crashes. It shone when stocks collapsed in 2000 to 2002 and 2008, thanks to its large position in long Treasuries. That same position made 2022, the inflation shock it was supposedly built for, its worst year and its slowest recovery. The retail recipe is a smooth, crash-resistant portfolio with a heavy bet on falling or stable interest rates, not a portfolio for every weather.
Data and method: stocks are the S&P 500 total return; long and intermediate Treasuries are Bondfish’s own calculation for constant-maturity 25-year and 8.5-year U.S. Treasury bonds, repriced monthly from month-end 30-year and 10-year Treasury yields; gold is the spot price in U.S. dollars; commodities are a broad commodity futures index on a total-return basis; the 60/40 uses a broad U.S. investment-grade bond index. Portfolios are rebalanced every December. Inflation is the U.S. Consumer Price Index, through August 2026. Period: January 1991 to September 2026, month-end. No fees, trading costs or taxes. Past performance does not predict future returns.
Every return, drawdown, risk share and attribution figure in this article is Bondfish’s own calculation from public market data, through September 2026. The underlying data:
This article is for general information only and is not investment advice. Investing involves risk, including possible loss of principal, and past performance does not guarantee future results. Backtested portfolio returns are hypothetical and do not reflect fees, taxes or trading costs. Consider your own circumstances or consult a licensed financial professional before investing.