
Does bond trend following momentum work? Yes, but mainly as insurance. In our backtest of 10-year U.S. Treasuries since 1963, a rule that holds bonds only while they are beating Treasury bills earned 6.4% a year against 5.7% for buy and hold, and cut the worst loss from -26% to -10%. It sat out 2022 entirely. The extra return was fragile, though: every version of the rule we tested reduced losses, but only one clearly beat buy and hold.
2022 was a banner year for trend followers. The largest trend-following funds, which ride price trends across futures markets, gained about 27% on average, according to industry tracking reported by Alternative Fund Insight. Bond holders had the opposite experience: a 10-year Treasury held at constant maturity lost 16.4% that year, its worst calendar year in our data going back to 1962. The obvious question for anyone who owns bonds: could a simple rule have spotted the trend and stepped aside?
Trend following (also called time-series momentum) is the idea that an asset that has been rising tends to keep rising for a while, and one that has been falling tends to keep falling. A trend follower does not forecast interest rates. It simply holds an asset while its recent return is strong and steps aside when it turns weak.
The evidence for the effect is well documented. A widely cited 2012 study in the Journal of Financial Economics found that the past 12-month excess return of 58 futures markets, including 13 government bond futures, predicted their returns in the following months. Professional managed-futures funds apply this across dozens of markets with leverage and short selling. Our question is narrower and more practical: does a plain, long-only version work for an ordinary bond investor?
We used the simplest version a retail investor could actually run, with one bond and one alternative:
The main test uses a constant-maturity 10-year U.S. Treasury from March 1963 to August 2026, the last complete month. We then repeated it for 5-year Treasuries, long Treasuries and investment-grade corporate bonds. Over the full period the rule switched 79 times, a little more than once a year, and held bonds about half the time.
The trend rule ended ahead of buy and hold, with much smaller losses along the way. It also beat inflation by a wider margin.
| 10-year Treasury (1963-2026) | Annual return | Real return | $100 became | Worst drop |
|---|---|---|---|---|
| Trend rule | 6.4% | 2.4% | $5,060 | -10% |
| Buy and hold | 5.7% | 1.7% | $3,332 | -26% |
| T-bills | 4.7% | 0.8% | $1,817 | 0% |
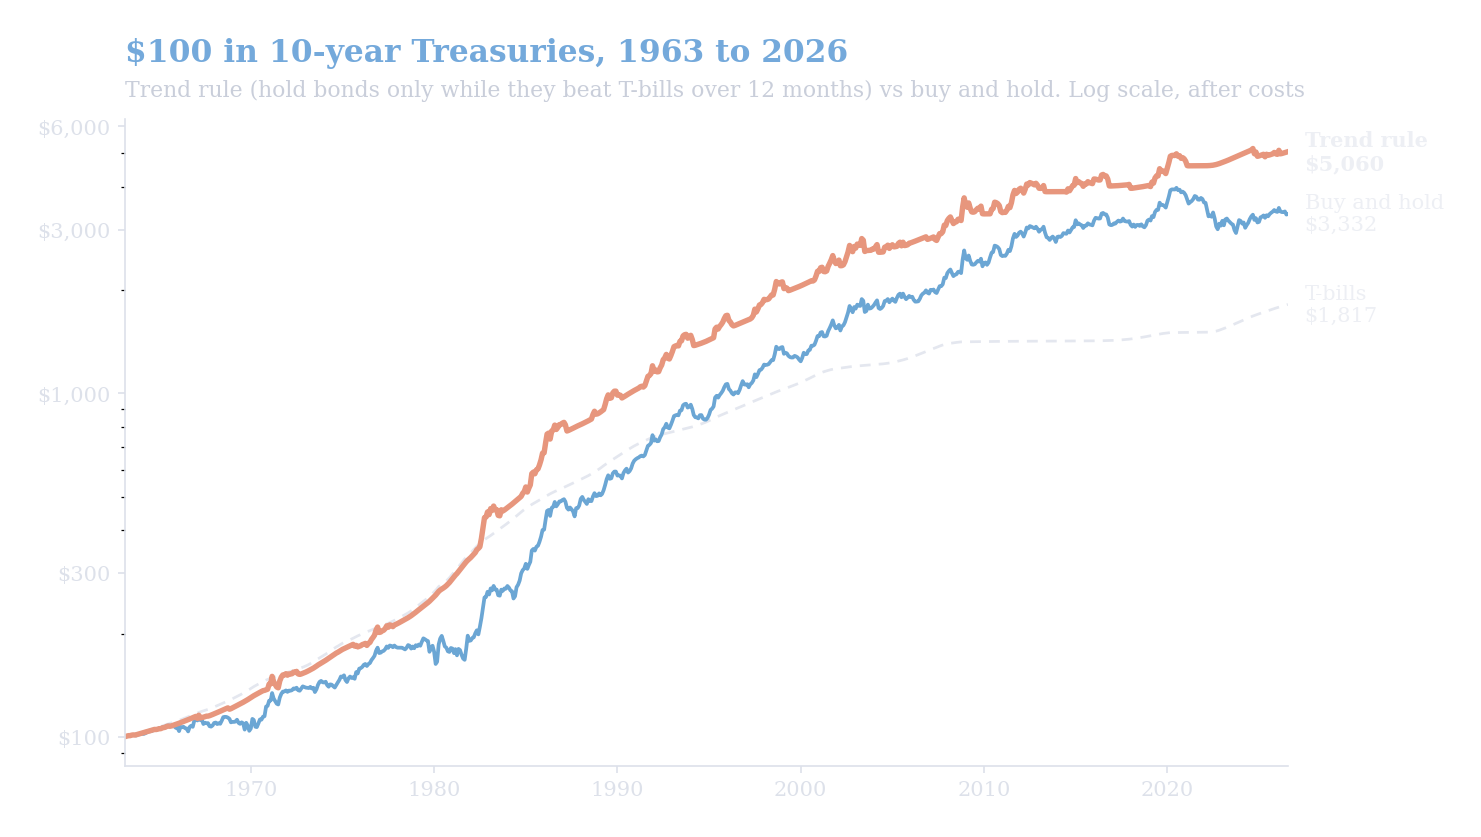
$100 in 10-year Treasuries grew to $5,060 under the trend rule and $3,332 under buy and hold. Source: U.S. Treasury yields via FRED; Bondfish analysis.
The headline numbers hide the real story, which is when the rule earned its keep. Split the history by interest-rate regime and a clear pattern appears.
Bond bear markets tend to be slow and persistent. Rates rise over months or years, not days, which gives a 12-month signal time to react. That is exactly the kind of market where trend following helps.
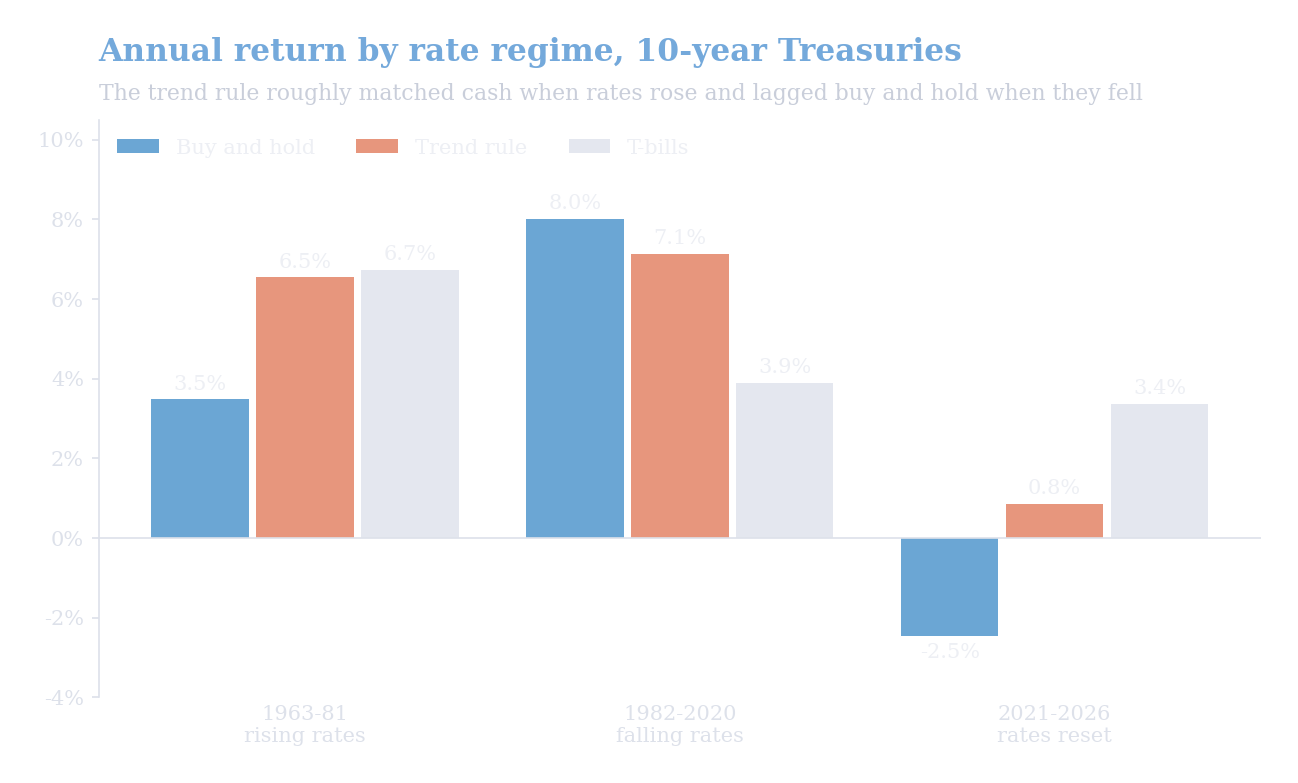
The trend rule roughly matched cash when rates rose and trailed buy and hold when rates fell. Source: U.S. Treasury yields via FRED; Bondfish analysis.
2022 shows the mechanism at its best. The 10-year Treasury's 12-month return fell behind T-bills in early 2021, and the rule moved to T-bills at the end of February 2021. It stayed there until the signal turned in the late summer of 2024, sitting out the whole of 2022 and earning 1.8% that year while buy and hold lost 16.4%. As of August 2026, a buy-and-hold 10-year Treasury was still 16% below its July 2020 peak.
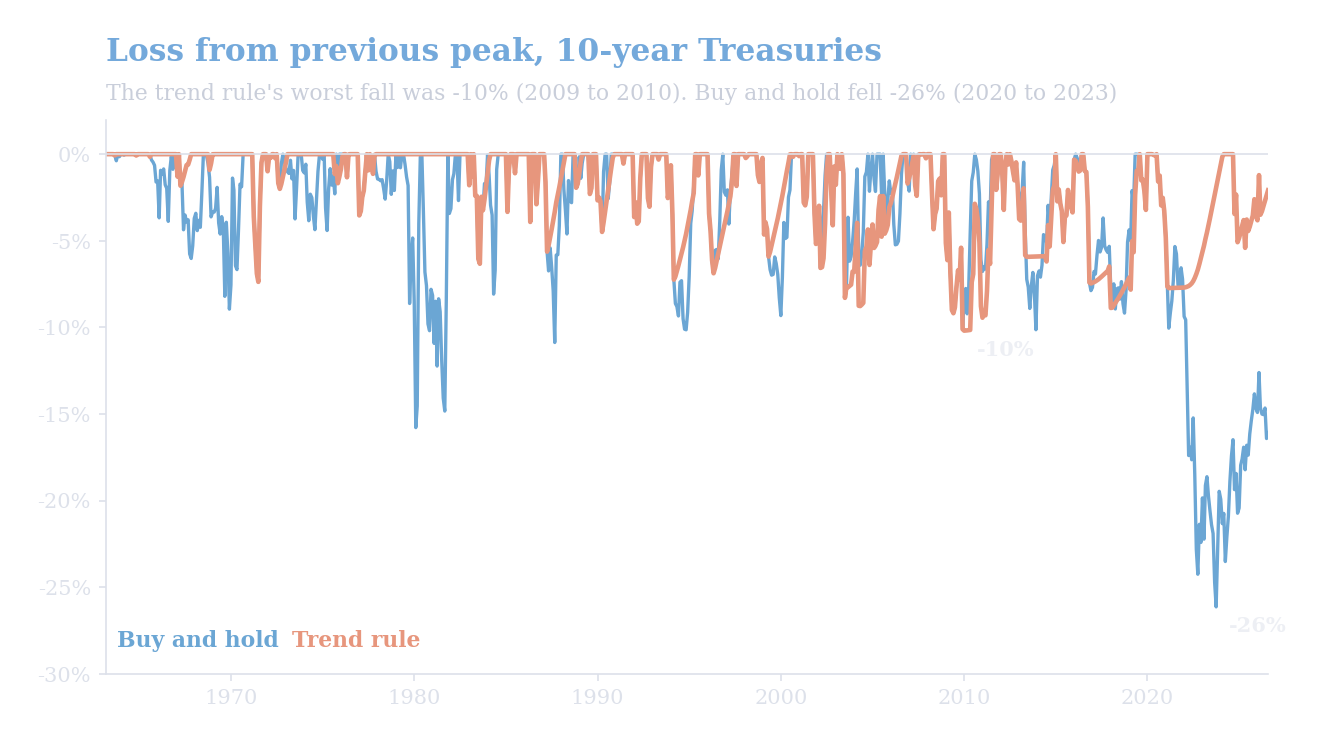
The trend rule's deepest loss was 10%. Buy and hold lost 26% from July 2020 to October 2023. Source: U.S. Treasury yields via FRED; Bondfish analysis.
A 12-month signal is slow by design, and that slowness cuts both ways. The rule's worst stretches came when rates changed direction abruptly:
These whipsaws (switching out just before a rebound, or back in just before a fall) are the price of the insurance. They explain why the rule gave up about 0.9 percentage points a year during the 1982-2020 bull market.
We repeated the test on three other kinds of bond. The pattern held: large cuts in the worst loss, and small or no gains in return.
| Bond type | Trend return | Hold return | Trend worst drop | Hold worst drop |
|---|---|---|---|---|
| 5-year Treasury (1963-2026) | 5.8% | 5.5% | -6% | -15% |
| Long Treasury (1963-2026) | 6.7% | 5.8% | -33% | -49% |
| Corporate, Baa (1987-2026) | 7.3% | 7.8% | -14% | -30% |
Long Treasuries (30-year bonds, or 20-year before 1977 when the 30-year was not published) show both sides of the trade most sharply. Their high duration, the sensitivity of price to interest rates, magnifies every rate move, as our guide to bond duration vs maturity explains. The trend rule cut the 2022 loss from 32.2% to 13.7%, but even it suffered a 33% fall from 2020 to 2025, because long bonds whipsawed several times after the initial crash. Momentum reduces the risk of long bonds. It does not make them safe.
Corporate bonds (Moody's Baa-rated long-term bonds, the lowest tier of investment grade) behaved much like Treasuries. The rule was in T-bills through both 2008, when it made 1.6% against a loss of 8.5%, and 2022, when it made 1.7% against a loss of 24.4%. Its long-run return was slightly lower than buy and hold's. We start this test in 1987 because earlier Baa yields are monthly averages, which smooth returns and would flatter any trend rule.
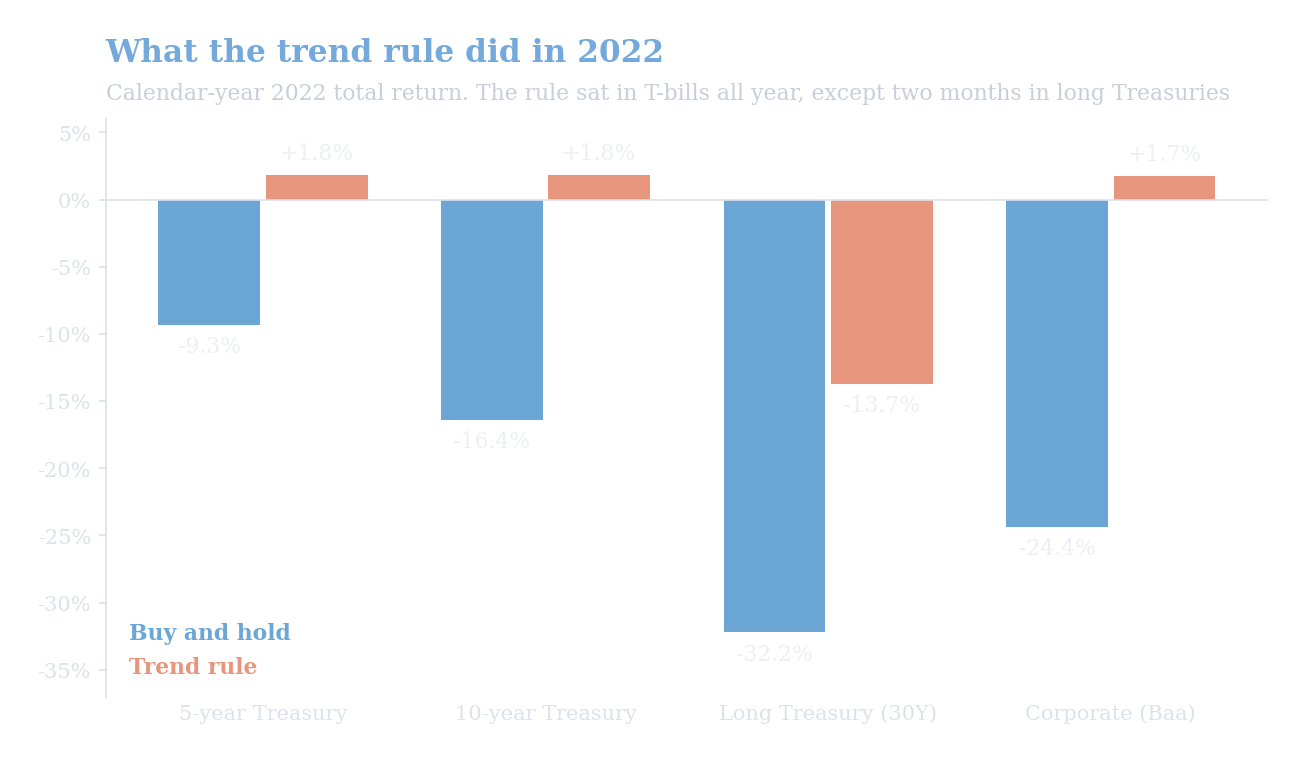
In 2022 the trend rule held T-bills for Treasuries and credit, except two months in long bonds. Source: U.S. Treasury and Moody's yields via FRED; Bondfish analysis.
Small changes to the rule change the result a lot, which is the main reason to be cautious. Here is the 10-year Treasury under five versions:
| Rule (10-year) | Annual return | Worst drop | In bonds | Trades a year |
|---|---|---|---|---|
| 12 months, beat T-bills | 6.4% | -10% | 51% | 1.2 |
| 12 months, above zero | 5.6% | -11% | 77% | 1.1 |
| 6 months, beat T-bills | 5.1% | -17% | 51% | 2.2 |
| 3 months, beat T-bills | 5.8% | -12% | 50% | 2.9 |
| Above 10-month average | 5.5% | -15% | 71% | 1.7 |
| Buy and hold | 5.7% | -26% | 100% | 0 |
Three lessons stand out:
Trading costs matter less than you might think at roughly one switch a year. Even at 0.50% per switch, five times our base case, the 12-month rule still returned 5.8% a year. Taxes are a different matter: in a taxable account, each switch out of a bond at a gain can create a tax bill, so check how your country treats bond sales.
As of the end of August 2026, the 10-year Treasury had returned about 0.1% over the previous 12 months, while T-bills returned about 3.9%. On our rule, that is a "hold T-bills" reading, as it has been for most of the period since early 2021. This is a description of the signal, not a recommendation: the rule has been wrong before, as 2009 and 2025 showed.
For investors who like the idea, the practical building blocks are simple: a bond or bond fund with the duration you want, and a T-bill or very short-dated government bond to switch into. You can find both on the Bondfish bond screener by filtering for maturity and credit risk. If you would rather cut rate risk permanently than time it, shortening duration is the simpler alternative; see short duration bond funds.
Trend following in bonds works, but as insurance, not a return booster. A simple 12-month momentum rule measured against T-bills sat out the great bond bear markets of the 1970s and 2022 and cut the worst loss on 10-year Treasuries from 26% to 10%. It lagged in bull markets, got caught by sudden reversals, and only one version clearly beat buy and hold. Use it to limit the damage of a long bear market, not to squeeze out extra return.
Data and method: bond returns are Bondfish's own calculation for constant-maturity U.S. Treasury bonds (5-year, 10-year and long) and a 20-year Baa corporate bond, repriced monthly from month-end yields published by the Federal Reserve and Moody's. Baa returns exclude default losses. Cash is the 3-month T-bill. Real returns use the U.S. Consumer Price Index. The trend rule decides at each month-end with data known at that date, holds the chosen asset for one month and pays 0.10% per switch. Period: March 1963 to August 2026 (Baa corporate from January 1987). Past performance does not predict future returns.
Every return, drawdown and signal in this article is Bondfish's own calculation from public data, through August 2026. The underlying data:
This article is for general information only and is not investment advice. Bond investing involves risk, including possible loss of principal. Consider your own circumstances or consult a licensed financial professional before investing.