
Extending bond duration before rate cuts has usually paid off, but timing decides everything. In five of the six Fed cycles since 1994, buying 30-year Treasuries right after the Fed’s final hike beat Treasury bills over the next two years, by 7 to 36 percentage points. The exception is the most recent one: investors who “locked in” after the July 2023 hike are still behind cash today, because long-term yields kept rising even after the Fed started cutting.
In 2023, the idea of locking in yields of around 5% before the Fed started cutting caught on with retail investors, and the fund flows show it. Money poured into long-dated Treasury funds: the largest of them, the iShares 20+ Year Treasury Bond ETF (TLT), roughly tripled its assets, from about $20 billion at the end of 2021 to a peak near $62 billion in August 2024. The cuts duly arrived, 1.75 percentage points of them between September 2024 and December 2025. Yet at the end of September 2026 the 10-year Treasury yielded about 5.3% and the 30-year about 5.6%, their highest month-end levels since 2002, and the Fed raised rates again in September. Since the end of July 2023, TLT has returned -11.2% including dividends, while T-bills earned about 15%.
So was the idea wrong, or just the timing? We tested the strategy across every Fed cycle for which the data is clean.
Duration measures how much a bond’s price moves when interest rates change. A 30-year Treasury has a duration of roughly 14 to 17 years, depending on its yield, so a one-percentage-point fall in yield lifts its price by about 14% to 17%, and a rise does the reverse. T-bills have almost none. (Our guide to bond duration vs maturity explains the difference.)
Extending duration means moving money from cash and short bonds into longer ones. The logic before a cutting cycle is simple: cash yields fall when the Fed cuts, while a long bond keeps paying the yield you bought it at, and its price rises if market yields drop. You “lock in” today’s rate for years. The risk is equally simple: if long yields rise instead, the price falls, and you have locked in a rate that later looks low.
We started in 1994, when the Fed began announcing its rate decisions publicly, which gives six complete hiking cycles: the last hikes came in February 1995, March 1997, May 2000, June 2006, December 2018 and July 2023. For each one we compared three places to hold money, all as total returns (price change plus income), month by month:
The Fed’s last hike is only obvious in hindsight, so we also tested rules an investor could follow in real time:
With hindsight, the trade worked remarkably well. Two years after the final hike, the 30-year Treasury had returned between 16% and 38% in five cycles, against 3% to 11% for T-bills. The 10-year delivered roughly 19% to 26% in the same five cycles. Over the first 12 months the picture was similar, with one near miss: after June 2006 the 30-year beat cash by less than one percentage point before the 2008 rally carried it far ahead.
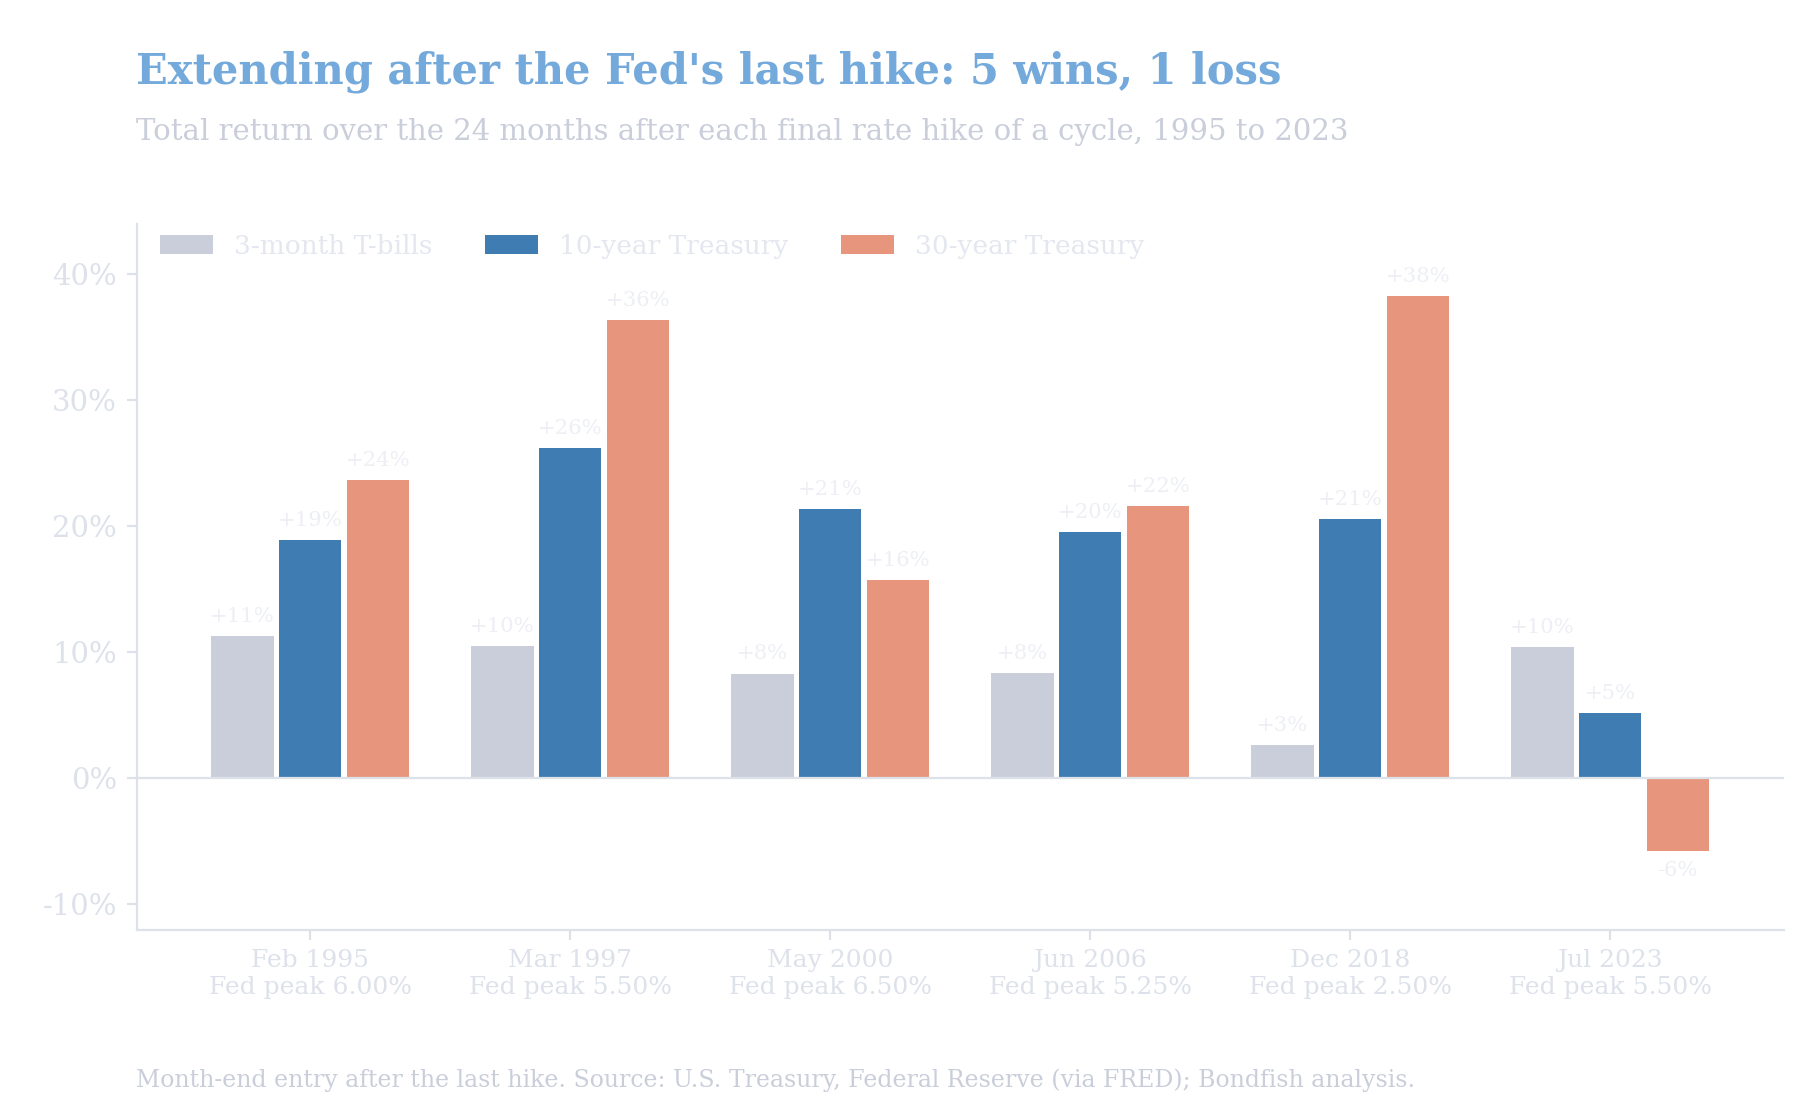
Long bonds beat cash in the two years after the last hike in every cycle except 2023. Source: U.S. Treasury, Federal Reserve (via FRED); Bondfish analysis.
The table adds two details that matter. “Months to cut” shows how long the Fed held at its peak before cutting, anywhere from 5 to 18 months. “Yield pickup” is the 30-year yield minus the T-bill yield at the month-end you extended, in percentage points: what you gained, or gave up, in income by locking in.
| Last hike (Fed peak) | Months to cut | Yield pickup | T-bills, 2 yrs | 30-year, 2 yrs |
|---|---|---|---|---|
| Feb 1995 (6.00%) | 5 | +1.5 | +11.3% | +23.7% |
| Mar 1997 (5.50%) | 18 | +1.7 | +10.5% | +36.4% |
| May 2000 (6.50%) | 8 | +0.4 | +8.3% | +15.8% |
| Jun 2006 (5.25%) | 15 | +0.2 | +8.4% | +21.6% |
| Dec 2018 (2.50%) | 7 | +0.6 | +2.6% | +38.3% |
| Jul 2023 (5.50%) | 14 | -1.4 | +10.4% | -5.8% |
Fed peak is the target rate (upper end of the range since 2008). Returns are total returns over the 24 months after the month-end of the last hike. Source: U.S. Treasury, Federal Reserve (via FRED); Bondfish analysis.
Look at the last row. July 2023 is the only cycle in which long bonds paid less than cash at the moment of the last hike: 4.0% on the 30-year against 5.4% on T-bills. An investor who extended was accepting 1.4 percentage points less income per year and needed yields to fall just to break even. In every earlier cycle, the long bond paid at least as much as cash.
Many investors plan to extend “when the Fed starts cutting.” History says that is usually too late. In all six cycles, the 10-year yield was already lower by the time of the first cut than at the last hike, by about one percentage point on average and by as much as 2.5 points in 1997-98. The bond market prices the cuts long before the Fed delivers them.
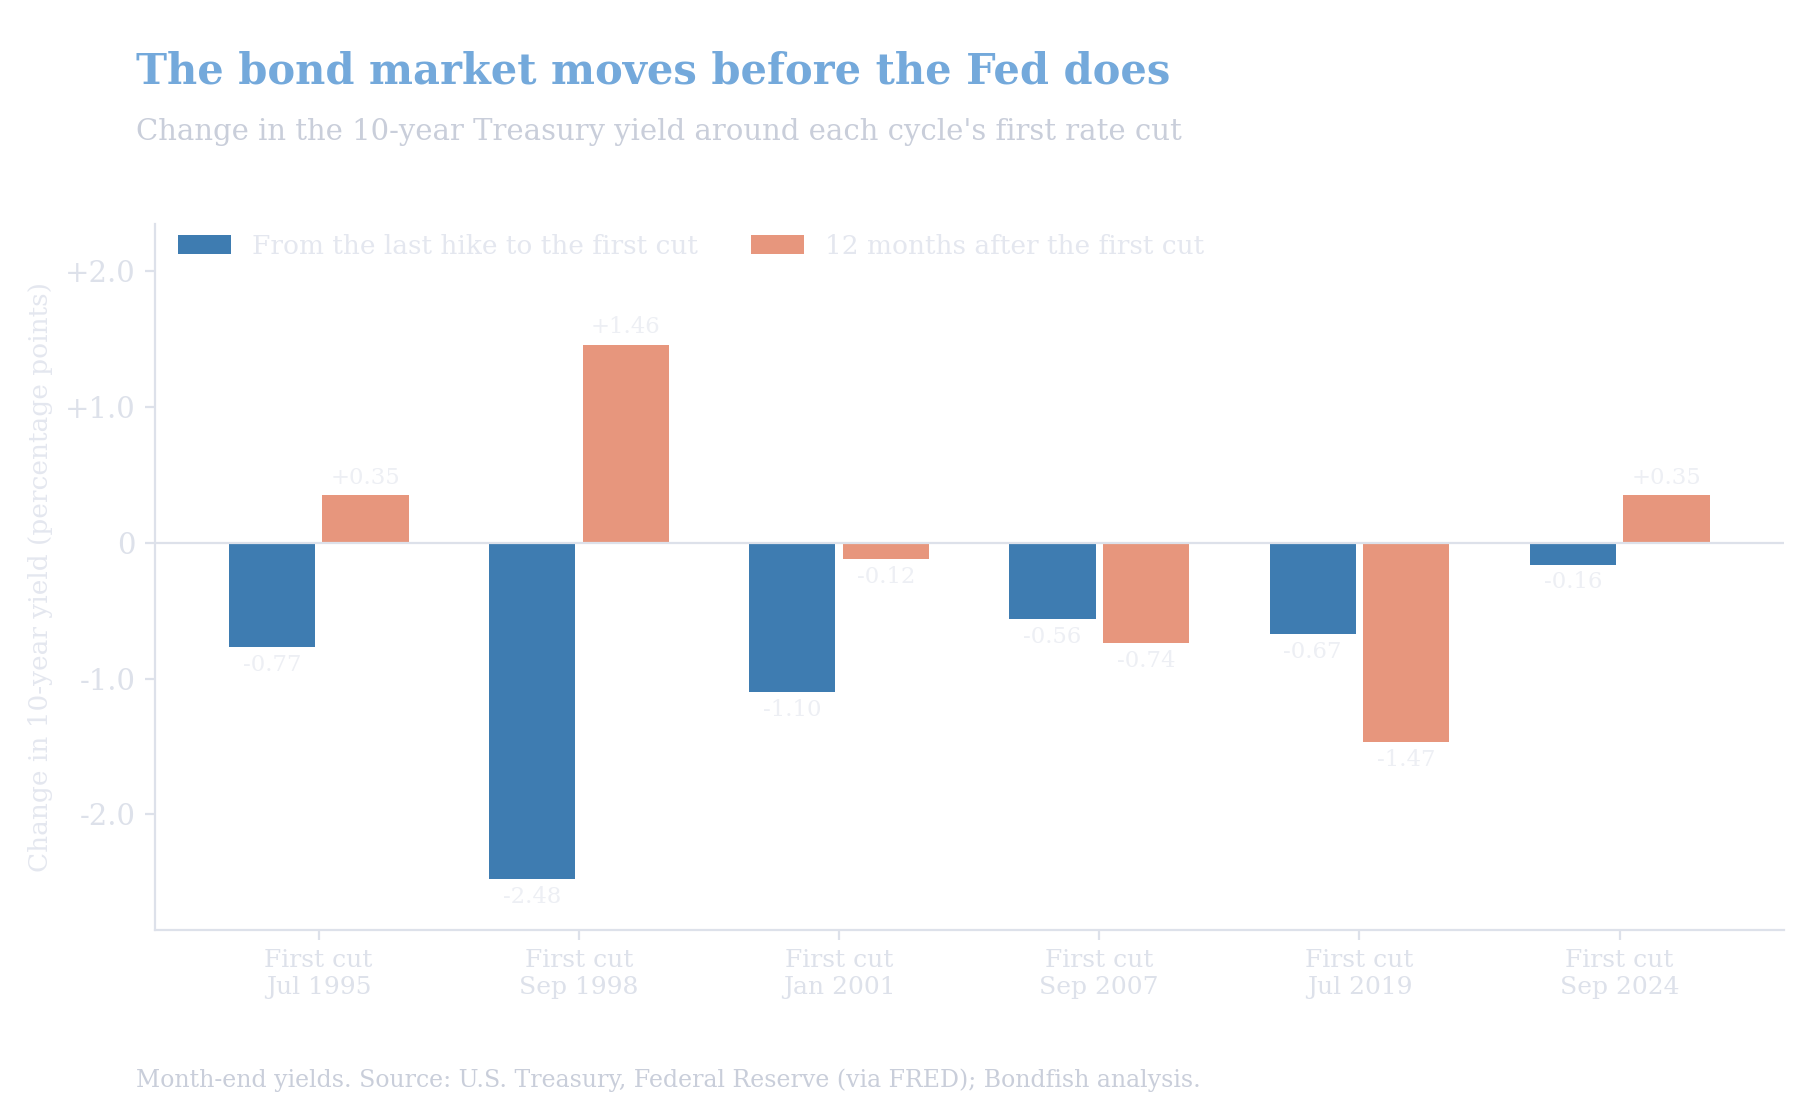
The 10-year yield fell before every first cut. After the cut, it rose in three of six cycles. Source: U.S. Treasury, Federal Reserve (via FRED); Bondfish analysis.
After the first cut, it was a coin toss. The 10-year yield rose over the next 12 months in three of the six cycles, including 2024-25, when it climbed from 3.8% at the first cut to 4.6% just four months later. Buying the 30-year at the first cut returned an average of 11% over two years, half the 22% average from buying at the last hike, and it lost to T-bills in two cycles out of six.
That is the general rule for how Fed interest rate news moves bond prices: prices react to changes in expectations, not to the announcement itself. By the time a cut is official, it is usually already in the price.
The 2023 cycle broke the pattern in three ways, and the chart shows each of them.
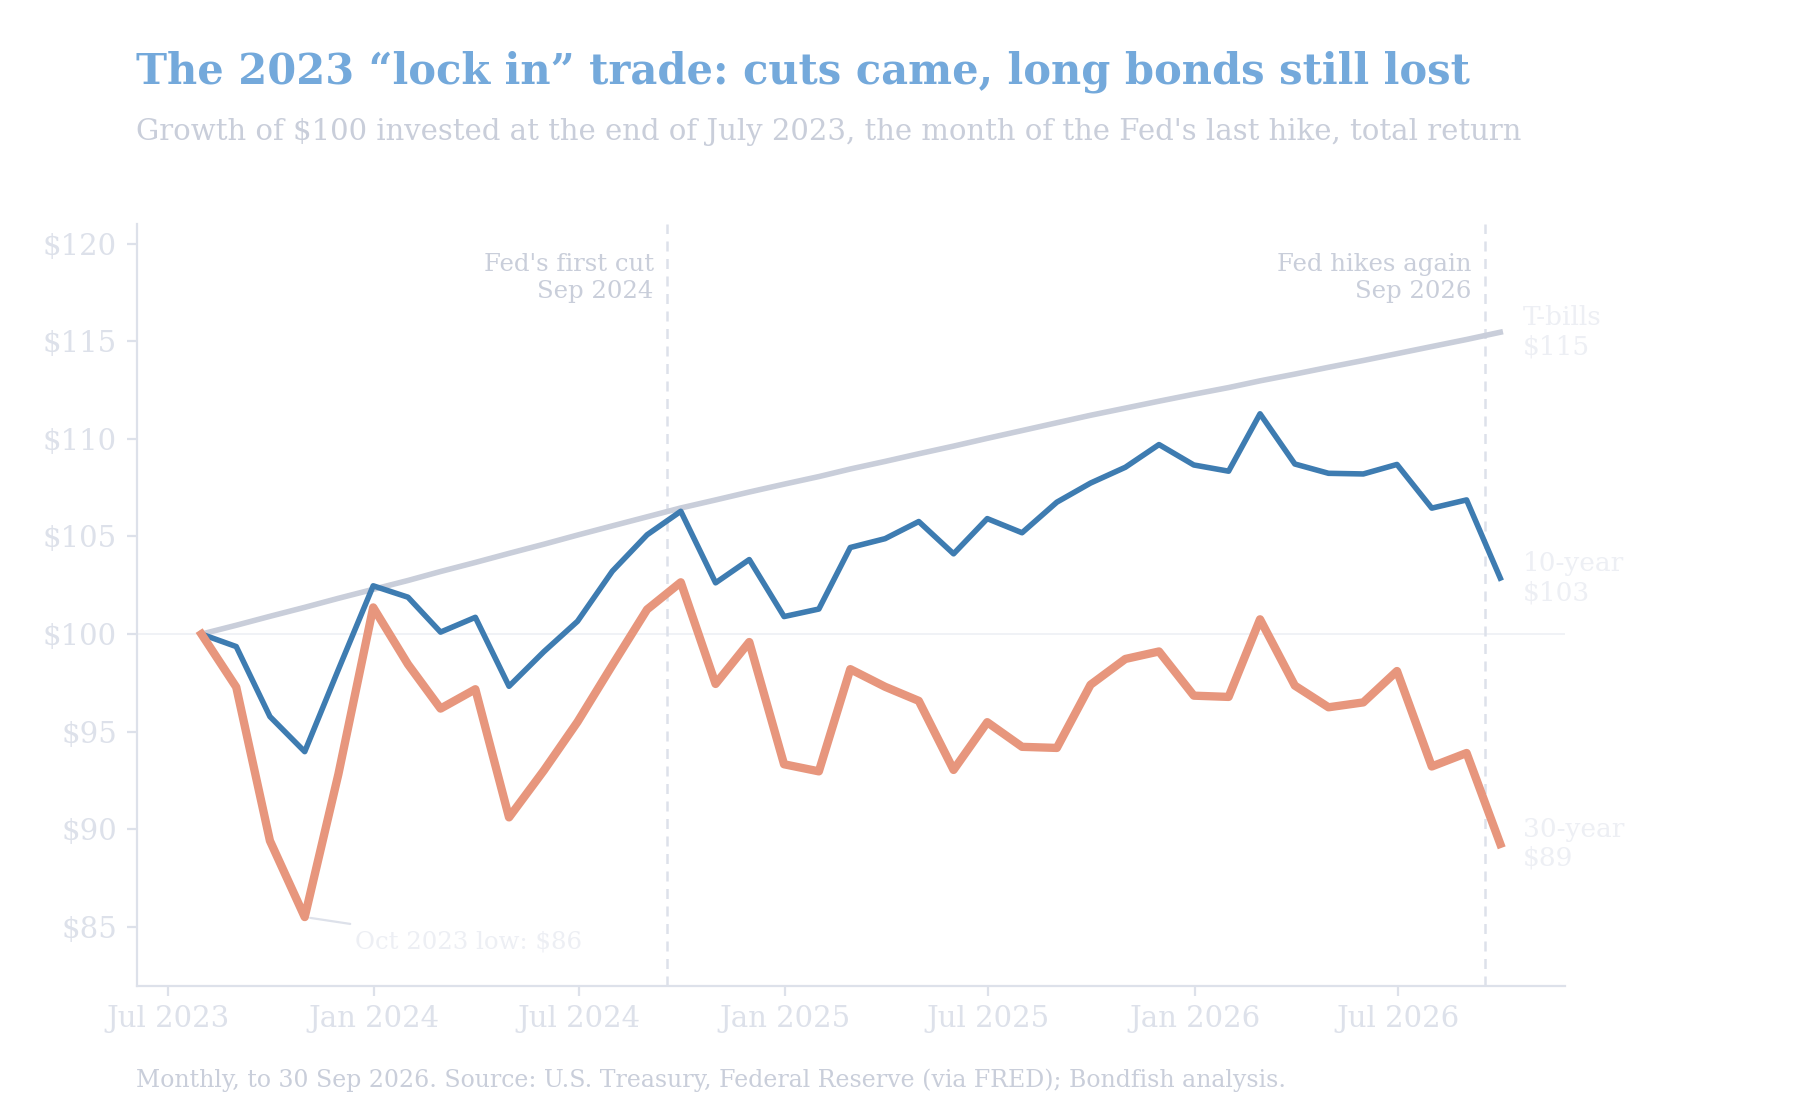
$100 in 30-year Treasuries at the end of July 2023 was worth $89 by September 2026, against $115 in T-bills. Source: U.S. Treasury, Federal Reserve (via FRED); Bondfish analysis.
From the end of July 2023 to the end of September 2026, the 30-year Treasury returned -10.7%, the 10-year +2.9%, the 2-year +14.0% and T-bills +15.5%. Even the more cautious pause rule, which waited until October 2023 and bought the 30-year at a 5.0% yield, earned 4.4% against 13.9% for T-bills. It came closer, but cash still won.
Finally, we ran each rule as a continuous strategy from February 1994 to September 2026: hold long bonds when the rule says so, T-bills otherwise.
| Strategy (30-year) | Annual return | $100 became | Worst drop | Time in bonds |
|---|---|---|---|---|
| Extend at the last hike (hindsight) | 5.5% | $570 | -31% | 75% |
| Pause rule, 3 months | 4.9% | $478 | -28% | 73% |
| Pause rule, 6 months | 3.8% | $339 | -28% | 67% |
| Wait for the first cut | 3.7% | $324 | -28% | 58% |
| 30-year, always | 4.6% | $436 | -49% | 100% |
| T-bills only | 2.6% | $228 | 0% | 0% |
February 1994 to September 2026, total return, 30-year Treasury as the long bond. Hypothetical, no costs or taxes. Source: U.S. Treasury, Federal Reserve (via FRED); Bondfish analysis.
Every rule beat T-bills by a wide margin. But only two beat simply holding the 30-year: perfect hindsight, and the three-month pause rule. Waiting six months or waiting for the first cut both did worse than never trading at all, which echoes Result 2: the longer you wait for confirmation, the more of the rally you miss. With the 10-year as the long bond the ranking was the same, and the pause rule returned 4.2% a year against 4.0% for buy-and-hold.
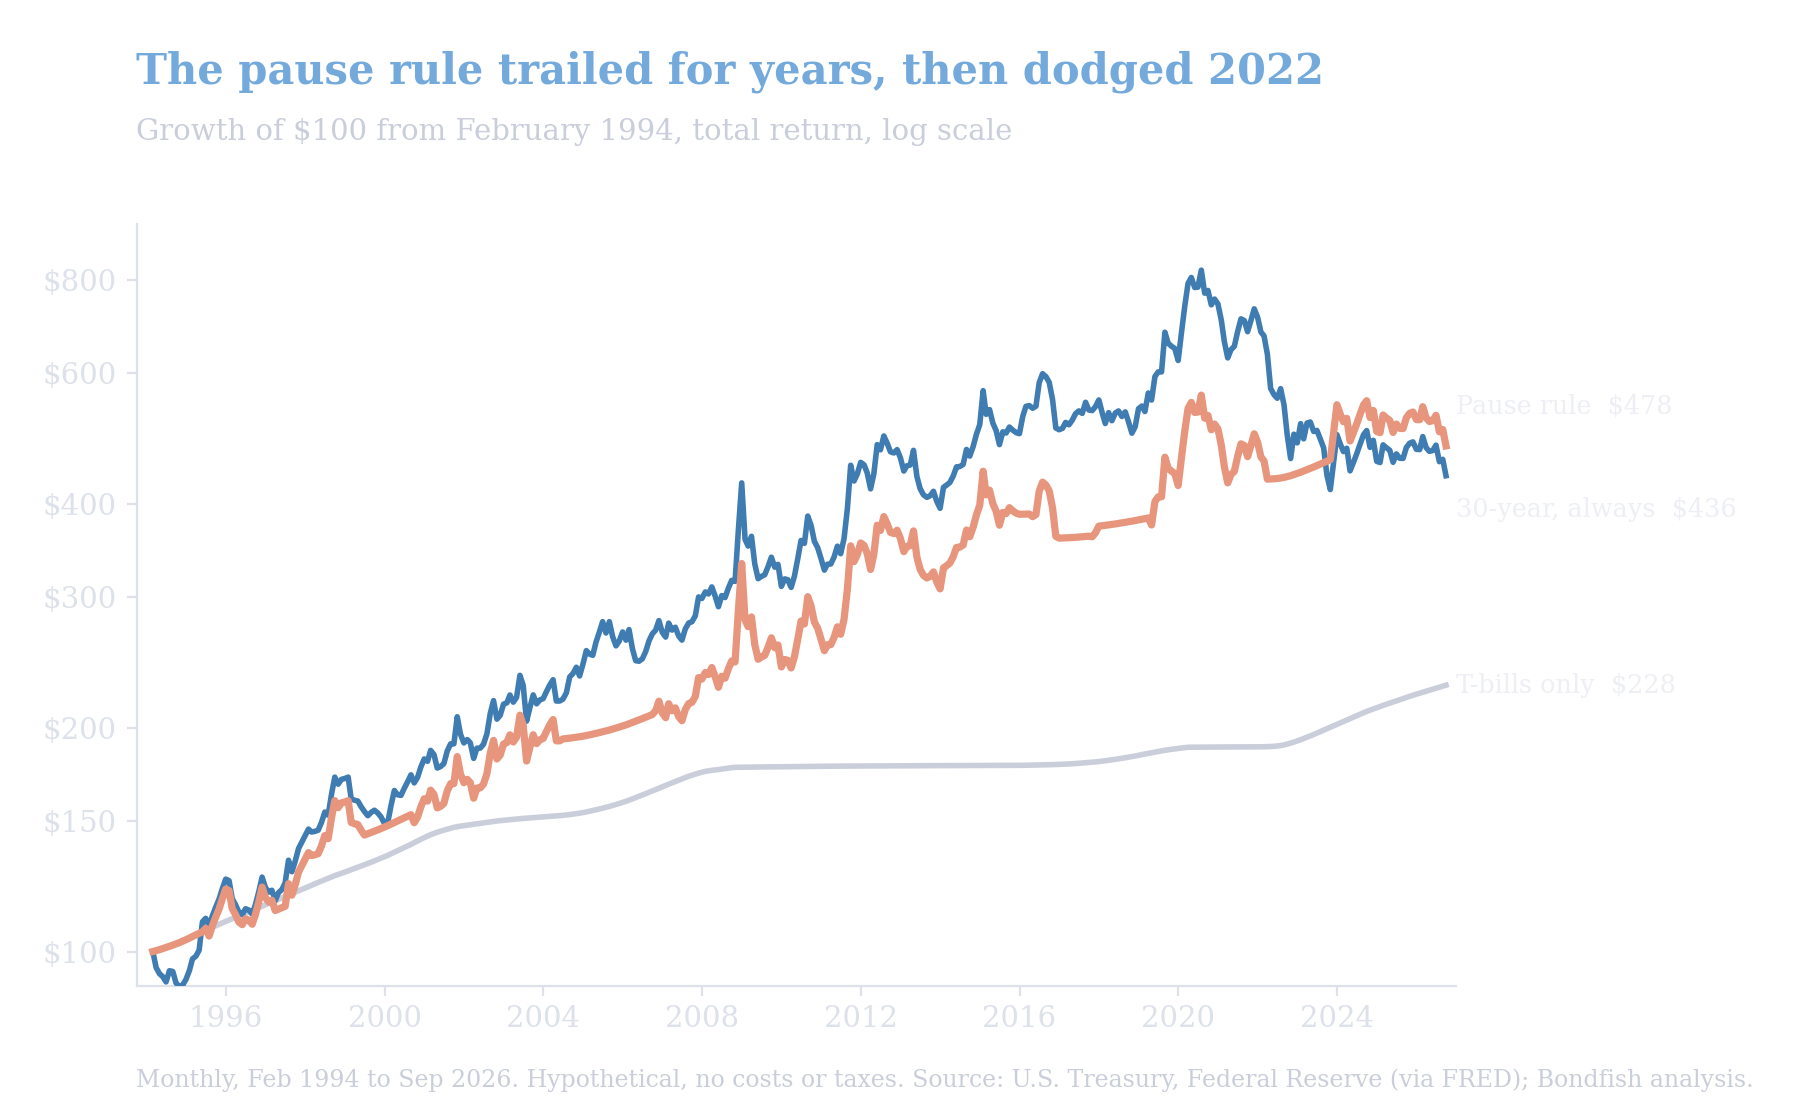
The pause rule finished ahead, but only after buy-and-hold collapsed in 2022. Source: U.S. Treasury, Federal Reserve (via FRED); Bondfish analysis.
The chart shows the catch. The pause rule trailed buy-and-hold for most of three decades: at the end of 2021, $100 had grown to $484 under the rule against $712 for the buy-and-hold 30-year. Sitting in cash during the slow hiking cycles of 2004-06 and 2015-18 cost money, because long bonds kept rising while the Fed hiked. The rule pulled ahead in one stroke by sitting out most of 2022, when it lost 9.2% against 32.2% for buy-and-hold. Its edge is real, but it comes from dodging rare disasters, not from steady outperformance.
We ran the same test on German government bonds (Bunds) around the European Central Bank’s four completed hiking cycles since 1999, comparing 2-, 10- and 30-year Bunds over the 24 months after the ECB’s last hike.
| Last ECB hike | 30y minus 2y | 2-year Bund | 10-year Bund | 30-year Bund |
|---|---|---|---|---|
| Oct 2000 | +0.5 | +12.4% | +16.3% | +19.8% |
| Jul 2008 | +0.4 | +10.2% | +22.6% | +34.4% |
| Jul 2011 | +2.1 | +2.3% | +11.4% | +21.7% |
| Sep 2023 | -0.2 | +7.2% | +6.0% | +0.0% |
“30y minus 2y” is the 30-year Bund yield minus the 2-year Bund yield at the last hike, in percentage points. Returns are total returns in euros over 24 months. Source: European Central Bank; Deutsche Bundesbank; Bondfish analysis.
The pattern is the same. Extending won clearly in 2000, 2008 and 2011, and failed in the most recent cycle. In September 2023 the ECB’s deposit rate was 4.00%, above the 2-, 10- and 30-year Bund yields (3.2%, 2.8% and 3.0%), so euro investors also faced negative carry. The 30-year Bund was up 15% after one year, then gave it all back. From September 2023 to September 2026 it returned -8.2%, against +7.4% for the 2-year. The ECB has since raised its deposit rate twice in 2026, to 2.50%.
The Fed raised its target range to 3.75%-4.00% in September 2026, its first hike since July 2023. Sixteen of 18 Fed officials expect at least one more increase this year, and in late September futures markets put the odds of an October hike at about two in three. On the strategy we tested, that is a “stay short” reading: the clock for extending starts only when the hiking stops.
That reading comes with two caveats from our own data. First, hiking cycles have not always been bad for long bonds. Measured from the first hike to the last, the 30-year lost to T-bills in 1994-95 (-2.3% vs +4.8%) and heavily in 2022-23 (-23.1% vs +4.8%), roughly tied in 1999-2000, and won in 2004-06 (+13.3% vs +6.5%) and 2015-18 (+8.0% vs +3.2%). Second, today’s curve looks nothing like 2023’s. At the end of September the 30-year yielded about 5.6% against roughly 4.1% for T-bills, so extending now earns more income than cash, not less.
For investors weighing the trade, the data points to a few practical lessons:
If you prefer individual bonds, the Bondfish bond screener lets you filter Treasuries and other bonds by maturity, yield and credit risk to see what locking in looks like at today’s rates.
Extending bond duration before rate cuts has a strong record: after the Fed’s last hike, long Treasuries beat cash over two years in five of six cycles since 1994, and the same was true for Bunds in three of four ECB cycles. But the edge comes from moving early, before the first cut, and the one big failure came when long bonds paid less than cash at the start. The 2023 “lock in” trade combined both problems. With the Fed hiking again, the rule we tested would only signal an extension once the hiking stops.
Data and method: bond returns are Bondfish’s own calculation for constant-maturity 2-, 10- and 30-year U.S. Treasury bonds, repriced monthly from month-end yields, with cash as the 3-month T-bill. Euro returns use the same method on 2-, 10- and 30-year German government bond yields. Fed rate decisions are taken from the Federal Reserve’s published history, using decision months; entries happen at the month-end after each signal. No trading costs or taxes are included. Period: February 1994 to September 2026 (euro: 1999 to September 2026). ETF figures for TLT are fund-reported total return including dividends and net assets. Past performance does not predict future returns.
Every return, drawdown and signal in this article is Bondfish’s own calculation from public data, through September 2026. The underlying data:
This article is for general information only and is not investment advice. Bond investing involves risk, including possible loss of principal, and past performance does not guarantee future results. Backtested strategy returns are hypothetical and do not reflect fees, taxes or trading costs. Consider your own circumstances or consult a licensed financial professional before investing.