
Our permanent portfolio backtest finds that Harry Browne’s mix of 25% stocks, 25% long-term Treasuries, 25% gold and 25% cash returned 9.2% a year from January 1972 to September 2026 (5.1% after inflation), against 9.6% for a 60/40 portfolio. It gave up a little return for a much smoother ride: its worst calendar year was −11.3% in 2022, against −17.4% for 60/40, and it never lost purchasing power over any 10-year stretch.
For most of the past four decades, the Permanent Portfolio looked like a relic. Why keep a quarter of your money in gold, which pays nothing, and another quarter in cash, while stocks compound at 10% a year? Then 2022 arrived. Stocks and bonds fell together, consumer prices rose 6.5% over the year, and a classic 60/40 portfolio lost 17.4%. In 2025, gold rose about 65% and the Permanent Portfolio returned 22.6%, its best year since 1982.
So is Browne’s “all-weather before All-Weather” worth owning? We rebuilt it from public market data and ran it through 54 years, following Browne’s own rules.
The Permanent Portfolio was devised by Harry Browne (1933–2006), an investment writer and twice the Libertarian Party’s U.S. presidential candidate. He described it in the early 1980s and set out the final rules in Fail-Safe Investing (1999). It splits your money equally among four assets, each chosen for a different economic climate:
Browne’s rules were specific. Buy the Treasury bond with the longest maturity and, when it has 20 years left, replace it with a new 30-year bond. Keep the cash in a money market fund that holds only short-term Treasuries. Once a year, check the mix: if any asset has grown above 35% or shrunk below 15% of the total, reset all four to 25%. The point is that you never need to predict which climate comes next, because something in the portfolio should be working. (It is not the same as the Permanent Portfolio mutual fund launched in 1982, which holds a broader mix.)
| Portfolio | Annual return | Real return | Worst year | Worst drop |
|---|---|---|---|---|
| Permanent Portfolio (Browne’s rule) | 9.2% | 5.1% | −11.3% | −14.9% |
| Permanent Portfolio, reset yearly | 8.7% | 4.6% | −11.3% | −14.9% |
| 60/40 | 9.6% | 5.4% | −17.4% | −26.5% |
| All-Weather | 9.0% | 4.9% | −17.9% | −19.9% |
| 100% stocks | 11.2% | 7.0% | −37.0% | −50.9% |
| Long Treasuries | 6.3% | 2.3% | −28.8% | −45.1% |
| Gold | 8.7% | 4.6% | −32.6% | −61.7% |
| 3-month T-bills | 4.6% | 0.7% | 0.0% | 0.0% |
January 1972 to September 2026, total return before fees and taxes. Real return = after U.S. inflation. Worst year = worst calendar year 1972–2025; worst drop = largest fall from a previous high.
$100 put into the Permanent Portfolio in January 1972 grew to $12,570 by September 2026, against $14,892 in 60/40 and $33,089 in stocks alone. The cost of the smoother ride was about 0.3 percentage points a year against 60/40 and 2 points against stocks. In exchange, the portfolio’s volatility was 7.6% a year, against 9.9% for 60/40 and 15.2% for stocks.
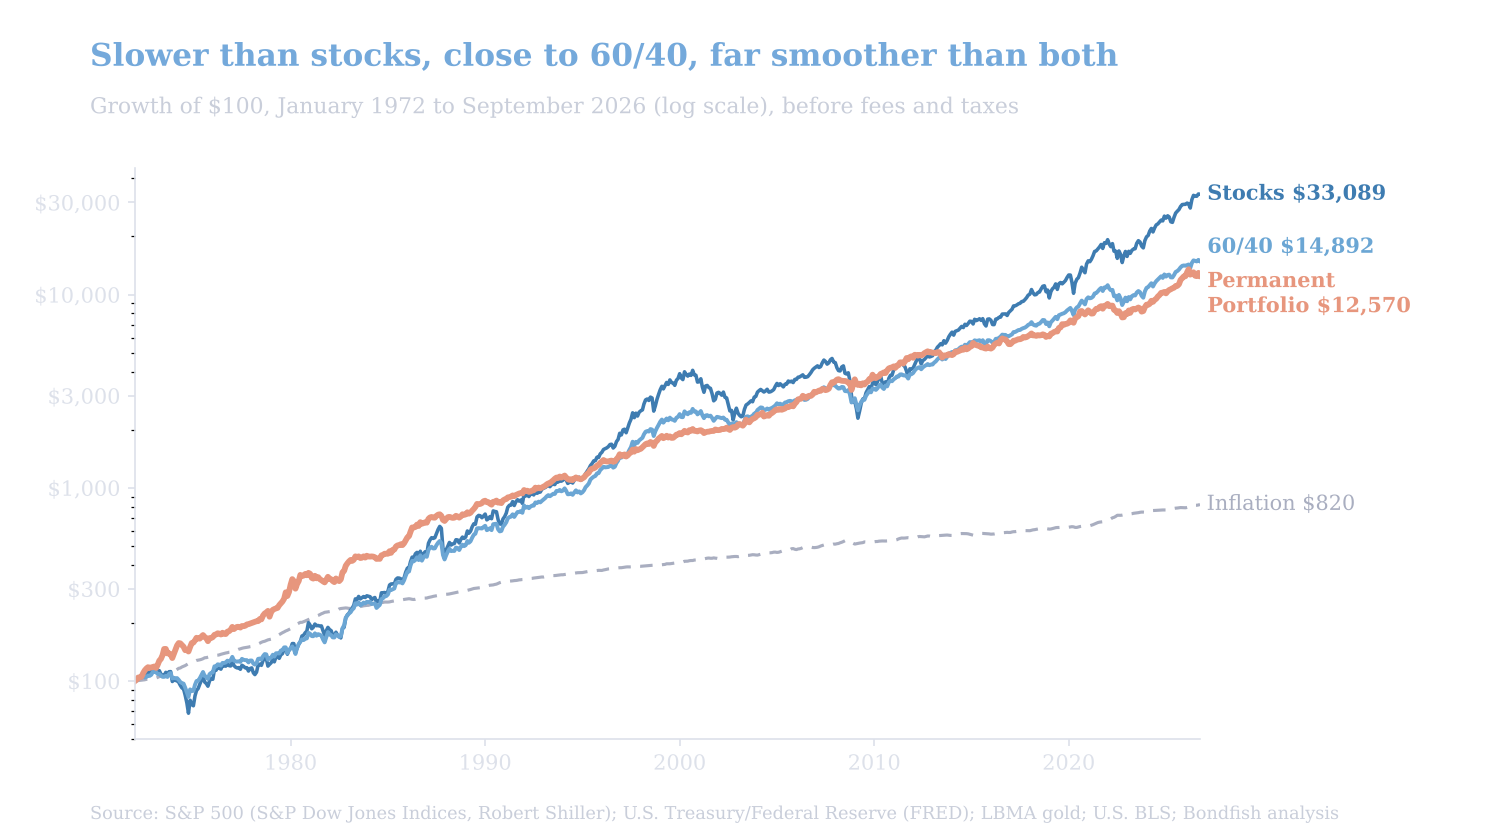
Growth of $100, January 1972 to September 2026, total return before fees and taxes. Permanent Portfolio rebalanced by Browne’s rule; 60/40 = 60% S&P 500, 40% 10-year Treasuries. Source: S&P 500 (S&P Dow Jones Indices, Robert Shiller); U.S. Treasury/Federal Reserve (FRED); LBMA gold; U.S. BLS; Bondfish analysis.
It lost money in 6 of 54 calendar years, against 10 for 60/40 and 11 for stocks. Its deepest fall, 14.9% from December 2021 to September 2022, was regained by February 2024. A 60/40 portfolio fell 26.5% in 2007–2009 and stocks 50.9%.
Browne’s rebalancing rule mattered more than you might expect. It rebalanced only 15 times in 54 years, and it added about half a percentage point a year compared with resetting to 25% every December (9.2% against 8.7%). Because the bands let winners run, the rule sold gold near its 1979–80 peak, sold stocks at the end of 1999 and 2021, just before bear markets, and bought stocks at the end of 2002, near the bottom. That was partly luck of timing, but it shows how the discipline works.
The four assets rarely moved together. Over the full period, the monthly returns of stocks, long Treasuries and gold were almost uncorrelated with each other, which is the engine of the whole strategy. In most bad years for stocks, something else stepped in.
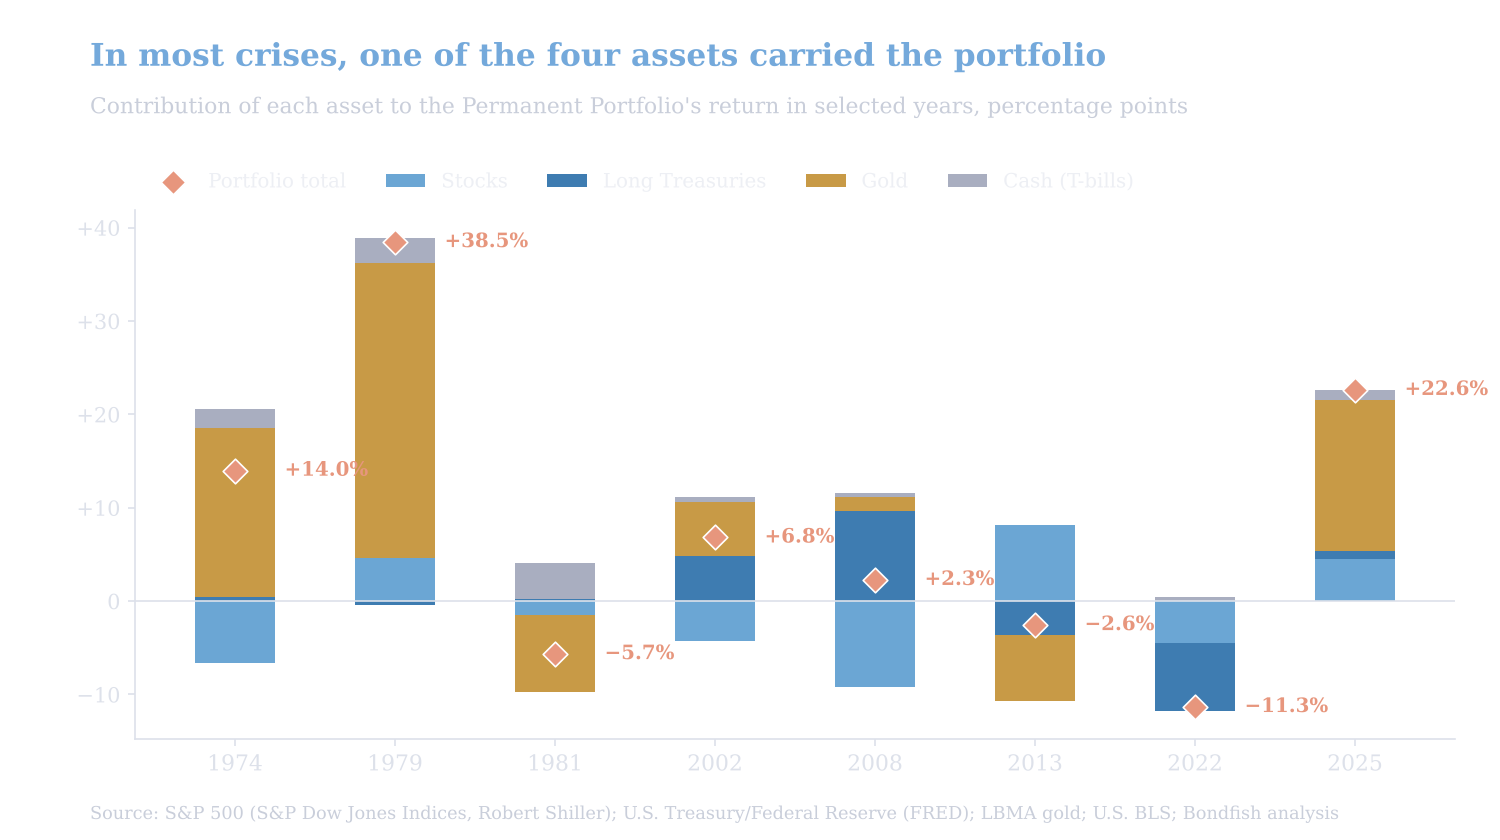
Contribution of each asset to the Permanent Portfolio’s calendar-year return, in percentage points, using each asset’s weight at the start of the year. Source: S&P 500 (S&P Dow Jones Indices, Robert Shiller); U.S. Treasury/Federal Reserve (FRED); LBMA gold; U.S. BLS; Bondfish analysis.
Browne built the portfolio to protect purchasing power, so inflation-adjusted returns are the fairest test. On that measure, the portfolio was remarkably steady: its real return stayed between 4.2% and 6.8% a year in every decade since the 1970s. A 60/40 portfolio swung from −2.9% in the 1970s to 11.0% in the 1990s.
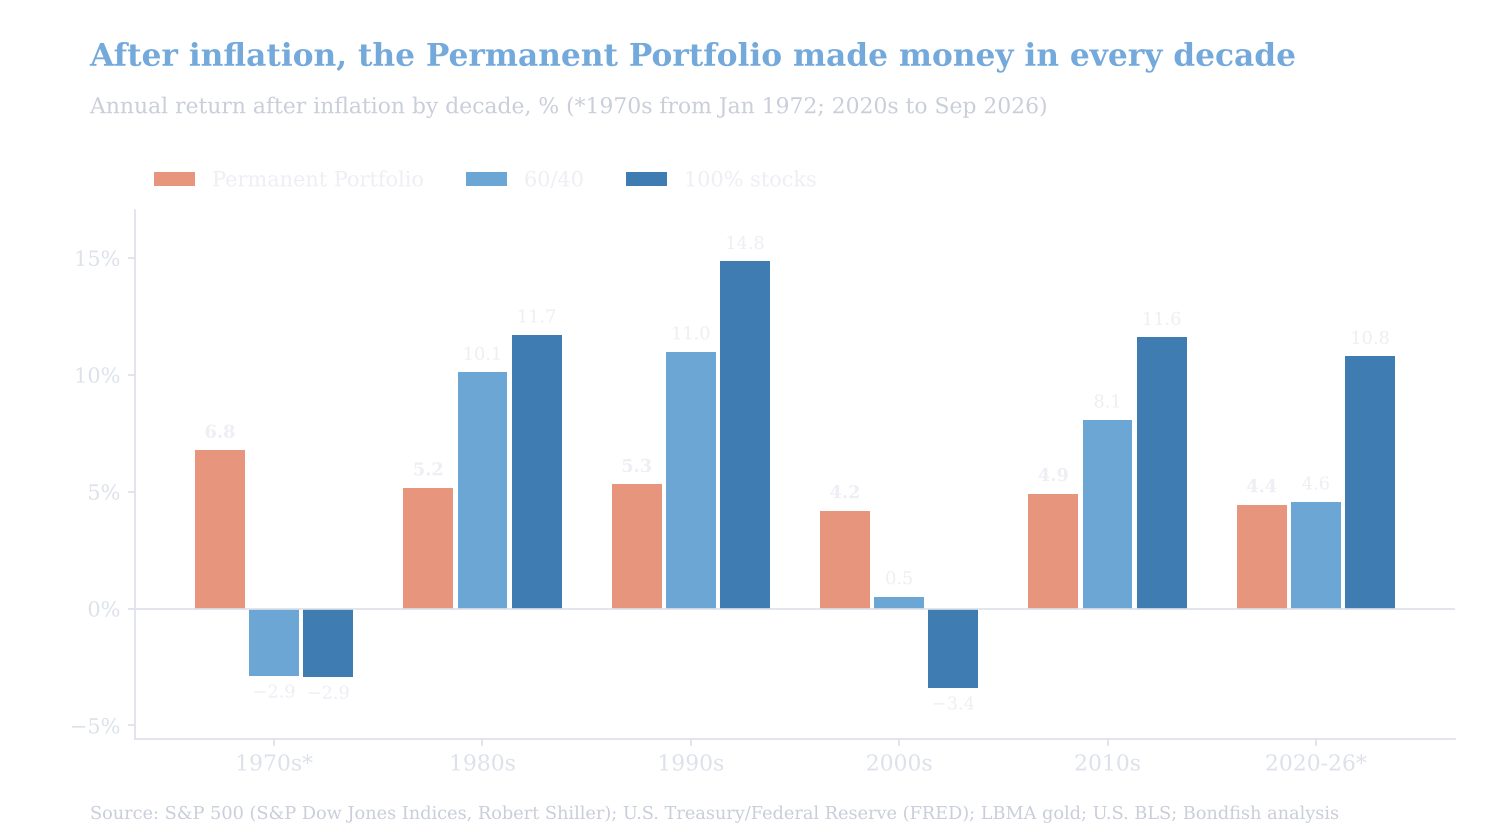
Annual return after U.S. inflation by decade; the 1970s start in January 1972 and the 2020s run to September 2026. Source: S&P 500 (S&P Dow Jones Indices, Robert Shiller); U.S. Treasury/Federal Reserve (FRED); LBMA gold; U.S. BLS; Bondfish analysis.
Its worst 10-year stretch still beat inflation by 1.6% a year (the decade to September 2022). The worst decade for 60/40 lost 3.6% a year after inflation (to June 1982), and for stocks 5.9% a year (to February 2009).
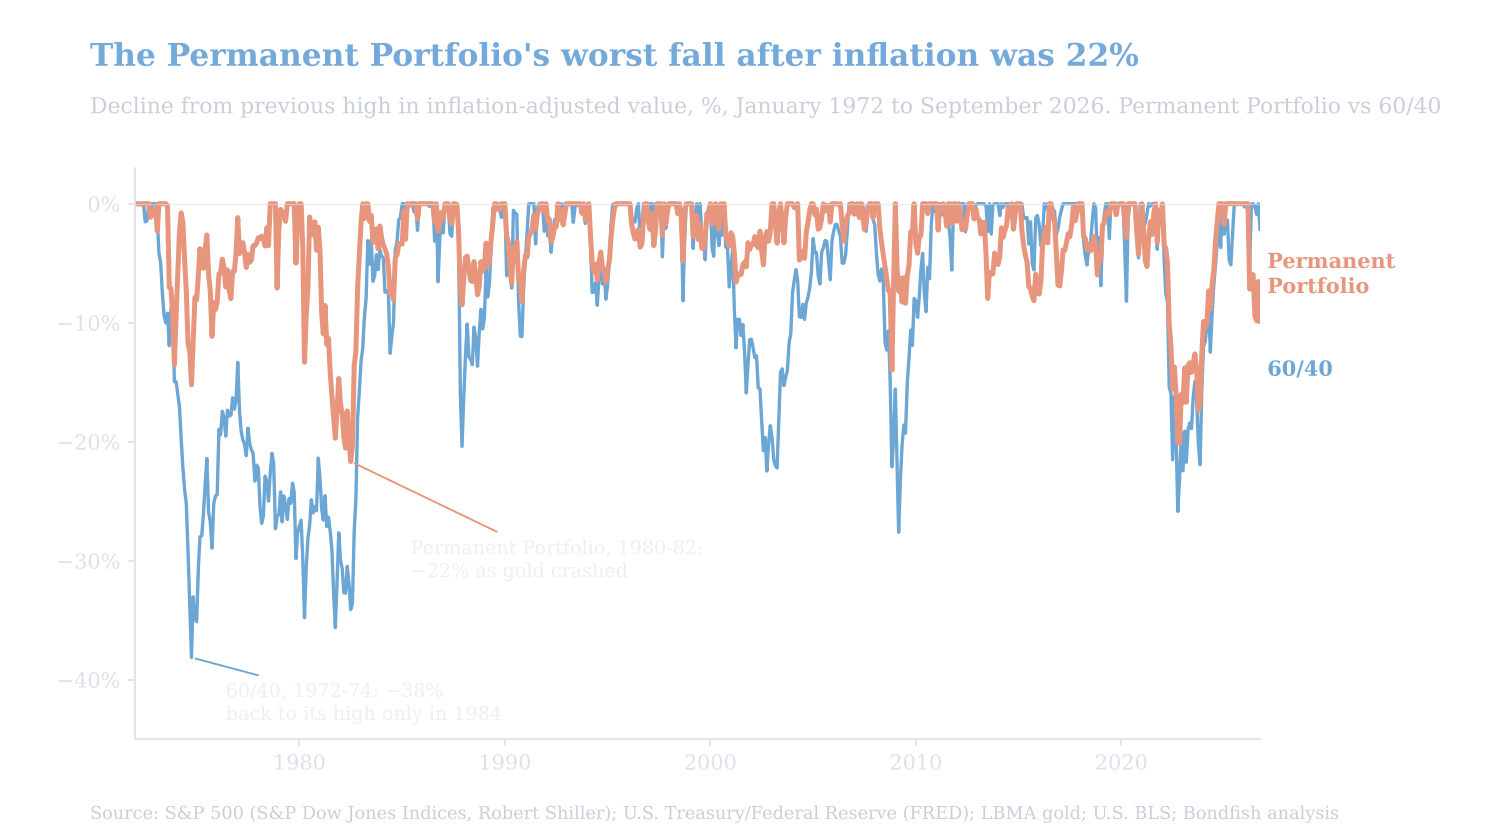
Decline from the previous high in inflation-adjusted value, January 1972 to September 2026. Source: S&P 500 (S&P Dow Jones Indices, Robert Shiller); U.S. Treasury/Federal Reserve (FRED); LBMA gold; U.S. BLS; Bondfish analysis.
Measured after inflation, the Permanent Portfolio’s deepest fall was 21.7%, from January 1980 to June 1982, as gold collapsed from its 1980 peak. It regained its real high by March 1983. The 60/40 portfolio lost 38.1% of its purchasing power between December 1972 and September 1974 and did not get it back until December 1984, twelve years later.
The backtest also shows what you give up. The full-period result flatters the Permanent Portfolio because it starts in the 1970s, the one decade when gold soared and stocks and bonds both lost money after inflation. Start the clock later and the picture changes.
| Start | Permanent | 60/40 | 100% stocks |
|---|---|---|---|
| 1972 | 9.2% | 9.6% | 11.2% |
| 1982 | 8.2% | 10.5% | 12.3% |
| 1991 | 7.8% | 9.2% | 11.3% |
| 2000 | 7.3% | 7.0% | 8.3% |
| 2020 | 8.5% | 8.8% | 15.3% |
Annual return before fees and taxes, from January of the start year to September 2026. Permanent = Permanent Portfolio with Browne’s rebalancing rule.
Since 2000 the Permanent Portfolio has essentially matched 60/40 (7.3% against 7.0% a year) with a much smaller worst drop (−14.9% against −26.5%). Whether it beats 60/40 in your lifetime depends heavily on when you start, and on gold.
Yes, and the cost is small. We ran the same portfolio with four U.S.-listed exchange-traded funds from December 2007 to September 2026 (the T-bill fund’s total-return history starts in late 2007), resetting to 25% every December.
| Sleeve | ETF (fee) | ETF | Index version | Gap |
|---|---|---|---|---|
| Stocks | SPY (0.09%) | 11.10% | 11.20% | −0.10 |
| Long Treasuries | TLT (0.15%) | 2.07% | 2.12% | −0.05 |
| Gold | GLD (0.40%) | 8.83% | 9.27% | −0.43 |
| Cash | BIL (0.14%) | 1.31% | 1.45% | −0.15 |
| Portfolio | 6.66% | 6.86% | −0.20 |
December 2007 to September 2026, annual return. Each sleeve 25%, reset every December. Index version = this article’s backtest series.
The ETF version returned 6.66% a year against 6.86% for our index version, a gap of 0.2 points: $10,000 grew to $33,685 instead of $34,884. The biggest piece of the gap is the gold fund’s 0.40% annual fee. In 2022 the ETF version lost 12.2%, against 11.3% for the index version.
Investors in the European Union generally cannot buy U.S.-domiciled ETFs like these, because they don’t publish the key information document EU rules have required since 2018. They use European-domiciled (UCITS) equivalents: an S&P 500 ETF, a 20+ year U.S. Treasury ETF and a physically backed gold product. Buying U.S. assets with euros adds currency risk, which our dollar-based backtest does not include. You can also hold the bonds directly; our guide to bond ETFs vs individual bonds covers the trade-offs, and you can screen Treasuries by maturity and yield to find long-dated issues.
Two of its four sleeves start from unusually high yields. On September 30, 2026, the 30-year Treasury yielded 5.64% and 3-month bills 4.20%, according to the U.S. Treasury; in our data, the 30-year yield had not ended a month that high since 2002. Gold closed September near $4,160 an ounce, after rising about 65% in 2025, but 21% below its February 2026 month-end high.
Following Browne’s rule, the portfolio last rebalanced in December 2024, when long Treasuries had shrunk just below 15%. By the end of September 2026, gold had grown to 32% of the mix and long Treasuries were back at 20%, with stocks at 27% and cash at 22%. The portfolio was up 0.9% for 2026 so far but 7.1% below its February peak, as gold pulled back.
The Permanent Portfolio tends to suit you if:
The Permanent Portfolio did what Harry Browne promised. From 1972 to 2026 it returned 9.2% a year, 5.1% after inflation, lost money in only 6 calendar years and made money after inflation in every decade. The price was about 0.3 points a year less than a 60/40 portfolio, long stretches of lagging stock-heavy portfolios, and heavy dependence on gold. It is a portfolio for protecting wealth, not maximizing it.
Stocks: S&P 500 total return, month-end, using S&P 500 index levels with Robert Shiller’s dividend data before October 1989. Treasury yields and T-bill rates: U.S. Treasury and Federal Reserve (FRED). Gold: LBMA spot gold price in U.S. dollars. Inflation: U.S. Bureau of Labor Statistics CPI-U. ETF comparison: total-return histories of SPY, TLT, GLD and BIL. Portfolio, bond and rebalancing results are Bondfish’s own calculation.
This article is for general information only and is not investment advice. Investing involves risk, including possible loss of principal. Past performance and historical backtests do not guarantee future results. Consider your own circumstances or consult a licensed financial professional before investing.