
In the bond ladder vs bond fund debate, neither structure wins on returns: from 1970 to September 2026, a 1–5 year Treasury ladder earned 5.83% a year and a fund holding the same maturities earned 5.79% before fees. They lost money in the same four calendar years and both fell 6.7% from their 2020 peak to the 2022 low. The ladder’s real advantages are lower costs and, if you hold each bond to maturity and spend it, a known payout on a known date.
The pitch for a bond ladder is simple. Buy bonds that mature one after another, hold each one to the end, and you get your money back no matter what interest rates do. A bond fund never matures, so when rates rise its price falls and stays down. After 2022, the worst calendar year for short-term Treasuries in our 56 years of data, that pitch found a big audience. Target-maturity ETFs, which package a ladder rung into a single fund, now number about 120 products with roughly $70 billion in assets, and Vanguard joined the market in 2026.
So does the ladder actually win? We built both from the same U.S. Treasury yields, month by month since January 1970, through the long rise in rates of the 1970s, the four-decade fall that followed, and the 2022 shock.
A bond ladder is a set of bonds with staggered maturities, say one maturing in each of the next five years. When the shortest “rung” matures, you either spend the money (a spend-down ladder) or buy a new 5-year bond at the top (a rolling ladder). Our bond ladder calculator guide walks through how to space the rungs.
A short-term bond fund holds a broad spread of bonds within a fixed maturity band and keeps that band forever. It sells bonds as they get too short and buys new ones at the long end, which is exactly what a rolling ladder does by hand. The differences investors usually cite:
The first point is the one that sells ladders. It is also the one our backtest puts to the test.
As a reality check, the same method applied to 3–7 year Treasuries tracked the iShares 3–7 Year Treasury Bond ETF (IEI) with a monthly correlation of 0.996 from 2007 to 2026. Our version earned 0.22 percentage points a year more than the real fund, close to the fund’s 0.15% annual fee plus trading frictions.
| Portfolio | Annual return | $100 became | Worst year | Worst drop |
|---|---|---|---|---|
| 1–5 year ladder | 5.83% | $2,474 | −5.0% | −6.7% |
| 1–5 year fund, no fee | 5.79% | $2,422 | −4.7% | −6.7% |
| 1–5 year fund, 0.15% fee | 5.63% | $2,226 | −4.8% | −7.0% |
| 1–10 year ladder | 6.32% | $3,226 | −9.1% | −13.1% |
| 1–10 year fund, no fee | 6.22% | $3,055 | −9.0% | −12.9% |
| 3-month T-bills | 4.57% | $1,260 | 0.0% | 0.0% |
U.S. Treasuries, January 1970 to September 2026, total return before taxes. Worst year = worst calendar year 1970–2025; worst drop = largest fall from a previous high.
Over 56 years, the 1–5 year ladder beat the fund by 0.04 percentage points a year before fees. That is a rounding error: $100 became $2,474 in the ladder and $2,422 in the fund. The 1–10 year versions finished just as close, at 6.32% against 6.22%.
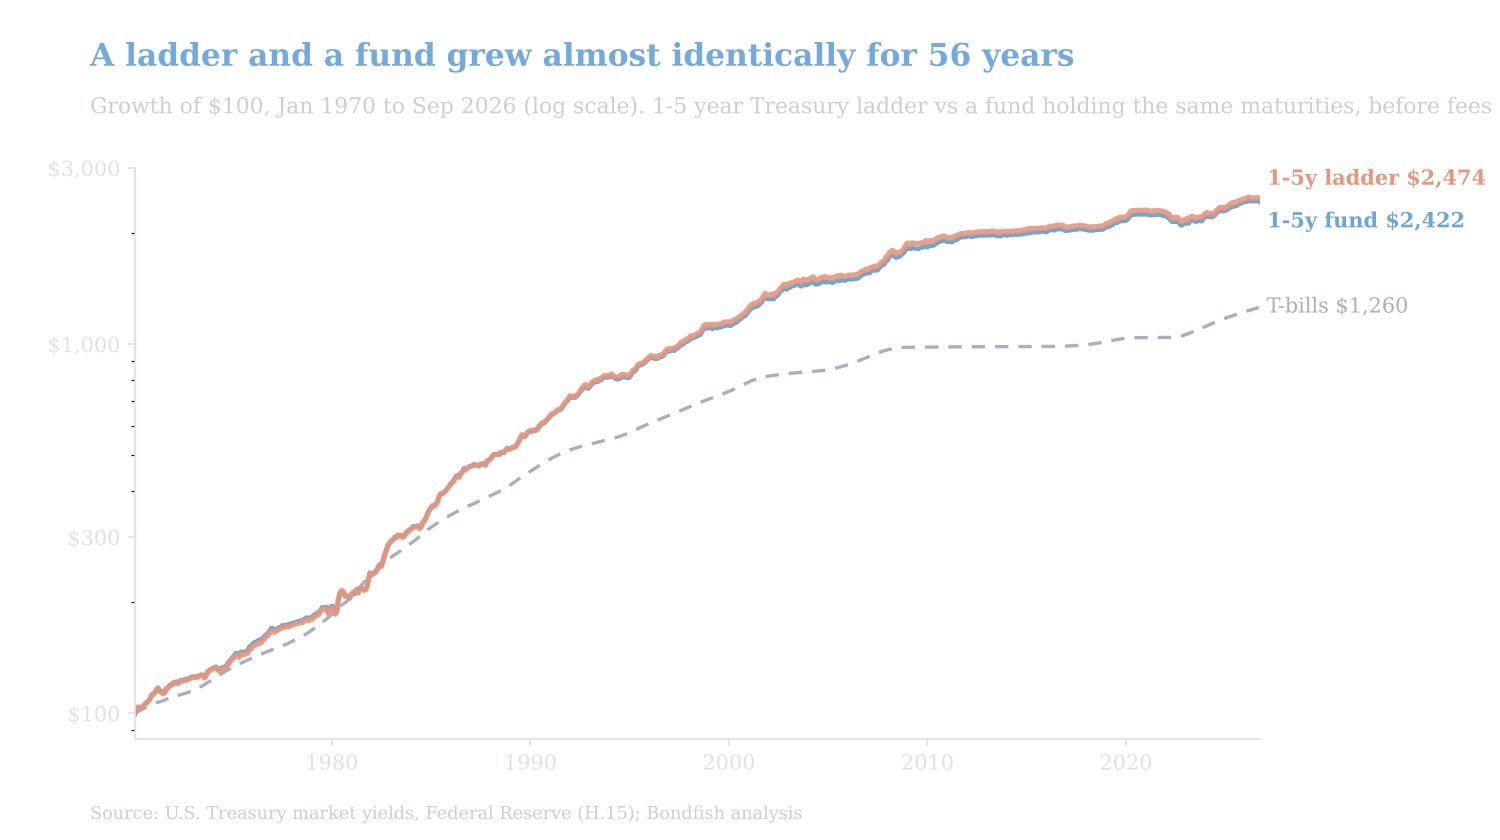
Growth of $100 in U.S. Treasuries, January 1970 to September 2026: a 1–5 year ladder vs a fund holding the same maturities, before fees and taxes (log scale). Source: U.S. Treasury market yields, Federal Reserve (H.15); Bondfish analysis.
Fees are what separate them. Charge the fund 0.15% a year, typical of Treasury index ETFs, and its return drops to 5.63%; $100 ends at $2,226, about 10% less than the ladder. Even at 0.03%, the fee on some of the cheapest short Treasury ETFs, the ladder stays ahead by about 0.07 points a year.
Year by year, the ladder came out ahead in 29 of 56 calendar years and the fund in the rest. The gap was within a quarter of a percentage point in 34 years and within half a point in 47.
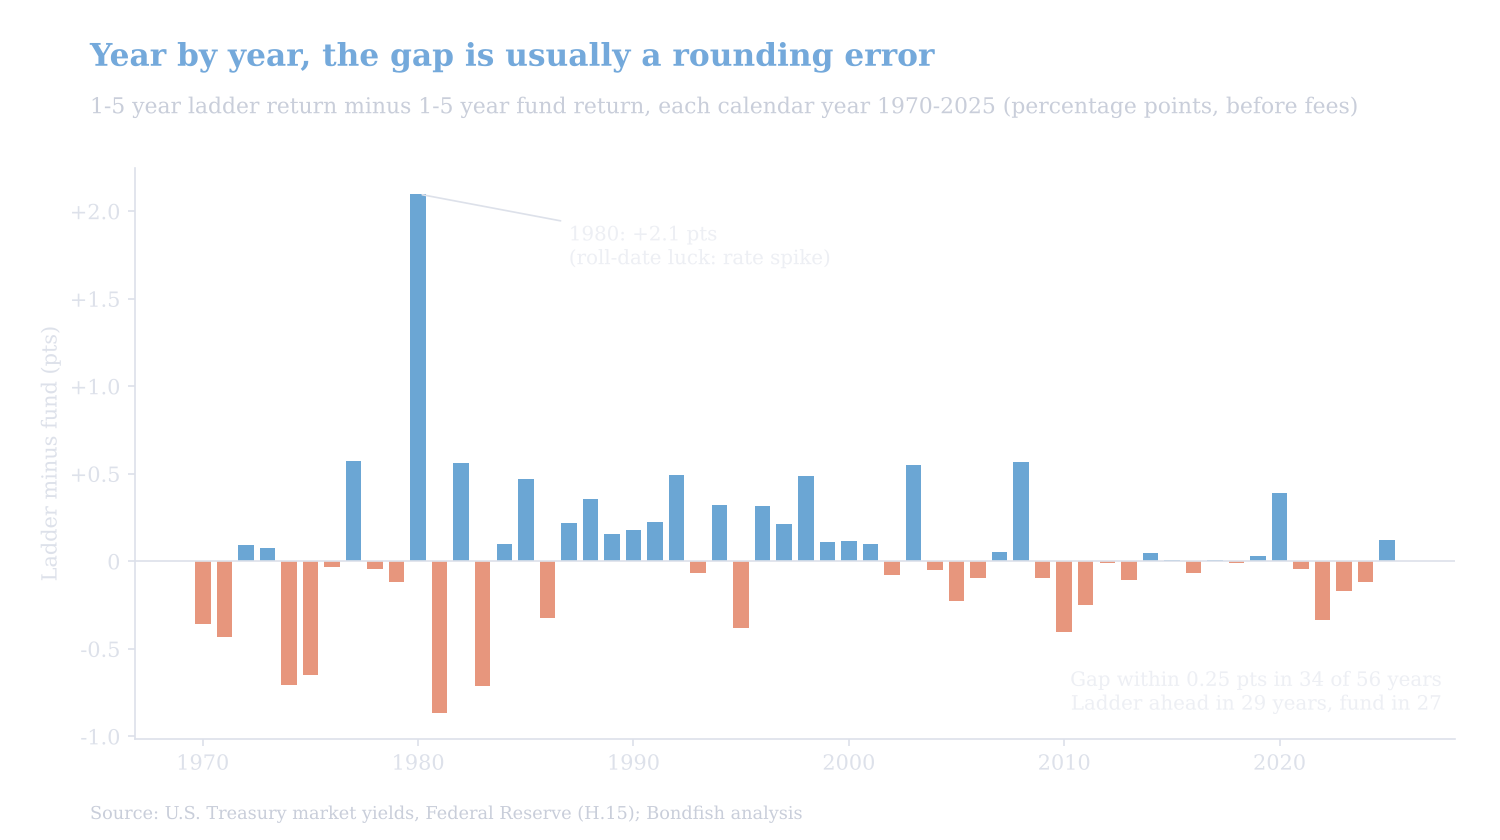
Calendar-year return of the 1–5 year ladder minus the 1–5 year fund, 1970–2025, in percentage points, before fees. Source: U.S. Treasury market yields, Federal Reserve (H.15); Bondfish analysis.
The biggest gap, 2.1 points in the ladder’s favor in 1980, was mostly luck. A ladder rolls once a year, so its result depends on whether it happens to buy its new 5-year note just before or just after a rate spike. Depending on which month the ladder rolled, its 1980 return ranged from 5.4% to 9.9%, against 7.5% for the fund.
Not in our data. The test that matters for the ladder’s pitch is a long stretch of rising rates, and the 1970s supplied the longest and steepest in our data: the 5-year Treasury yield went from 8.3% in January 1970 to 16.3% in September 1981.
| Era | 5-year yield | Ladder | Fund | T-bills |
|---|---|---|---|---|
| Rising: Jan 1970 to Sep 1981 | 8.3% to 16.3% | 6.91% | 6.94% | 7.45% |
| Falling: Sep 1981 to Jul 2020 | 16.3% to 0.2% | 6.26% | 6.18% | 3.95% |
| Rising: Jul 2020 to Sep 2026 | 0.2% to 5.1% | 1.16% | 1.23% | 3.13% |
Annual return in each interest-rate era, 1–5 year portfolios, before fees. Eras run between the 5-year Treasury yield’s major highs and lows.
In both rising-rate eras the ladder and the fund finished within 0.1 percentage point of each other, and both trailed T-bills, whose yields reset higher every few months as rates climb. They also lost money in the same calendar years: 1994, 2013, 2021 and 2022.
The 2022 shock shows why. From July 2020 to October 2022, the ladder and the fund both fell 6.7%, and both regained their old high in July 2024. A ladder’s individual bonds still repay their face value, but until they do, the money is stuck in notes paying yields below the market’s. That shortfall is real, whether or not you see it on a statement. A fund recovers the same way a ladder does: by reinvesting at the new, higher yields as old bonds mature or are sold. That is why interest rate risk depends on how long your bonds are, not on whether you hold them in a ladder or a fund.
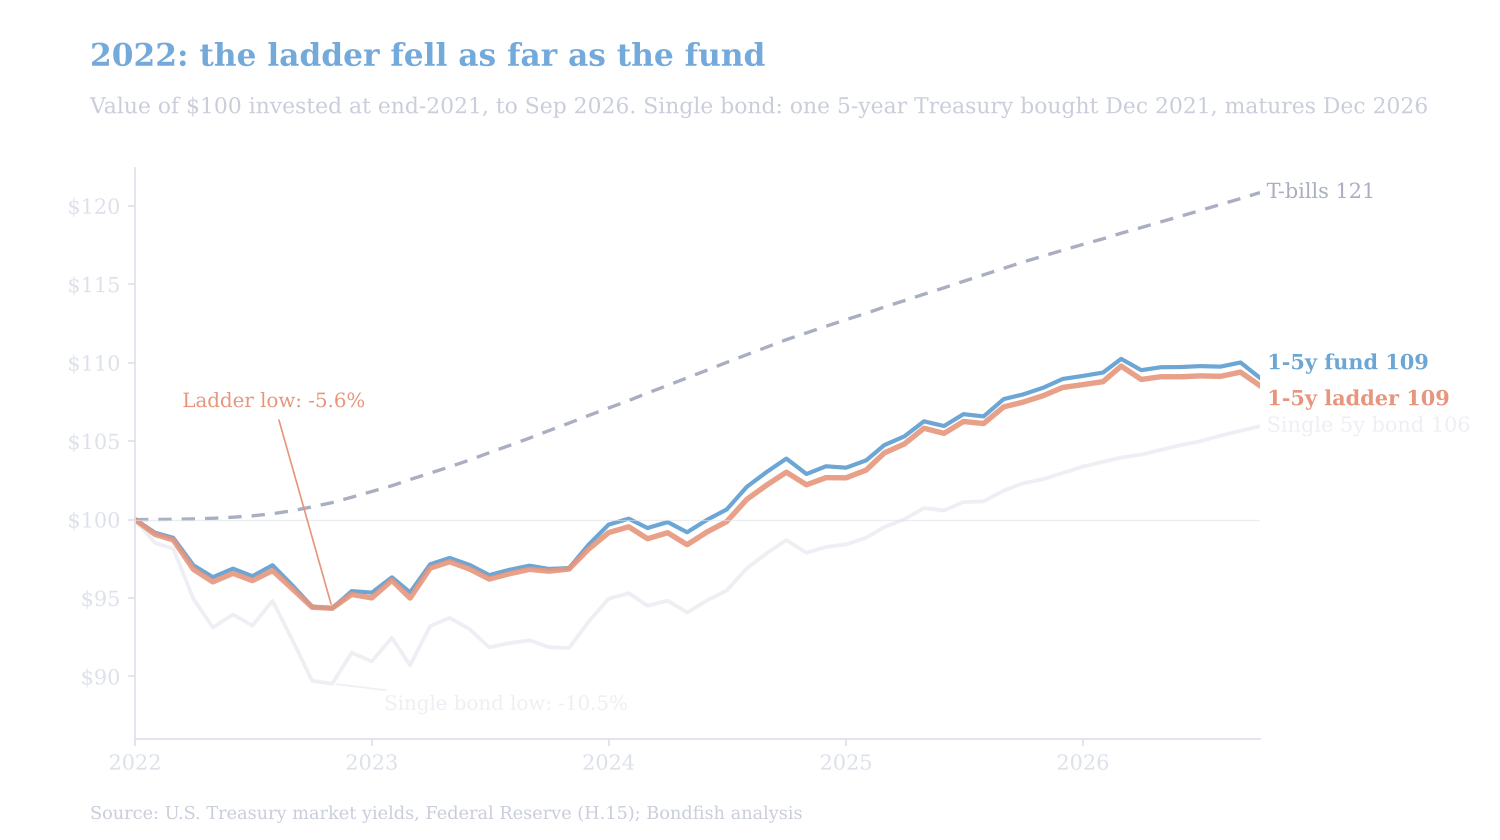
Value of $100 invested at the end of December 2021, through September 2026. The single bond is one 5-year Treasury bought in December 2021 that matures in December 2026. Source: U.S. Treasury market yields, Federal Reserve (H.15); Bondfish analysis.
Someone who put $100 into each at the end of 2021 saw the ladder down 5.6% and the fund down 5.7% at the October 2022 low. A single 5-year Treasury, the purest “hold to maturity” bet, fell 10.5%, because a longer bond carries more interest rate risk, and didn’t get back to $100 until March 2025. A real target-maturity ETF followed the single-bond pattern. The iBonds Dec 2025 Term Treasury ETF (IBTF), launched in February 2020, fell 9.8% from its July 2020 high to October 2022, regained that high in March 2025 and finished with a total return of 7.1% at maturity in December 2025, about 1.2% a year.
There is one thing a single bond held to maturity does that a fund cannot: it delivers close to the yield you bought it at. We checked every 5-year period starting from February 1970 to September 2021, 620 in all.
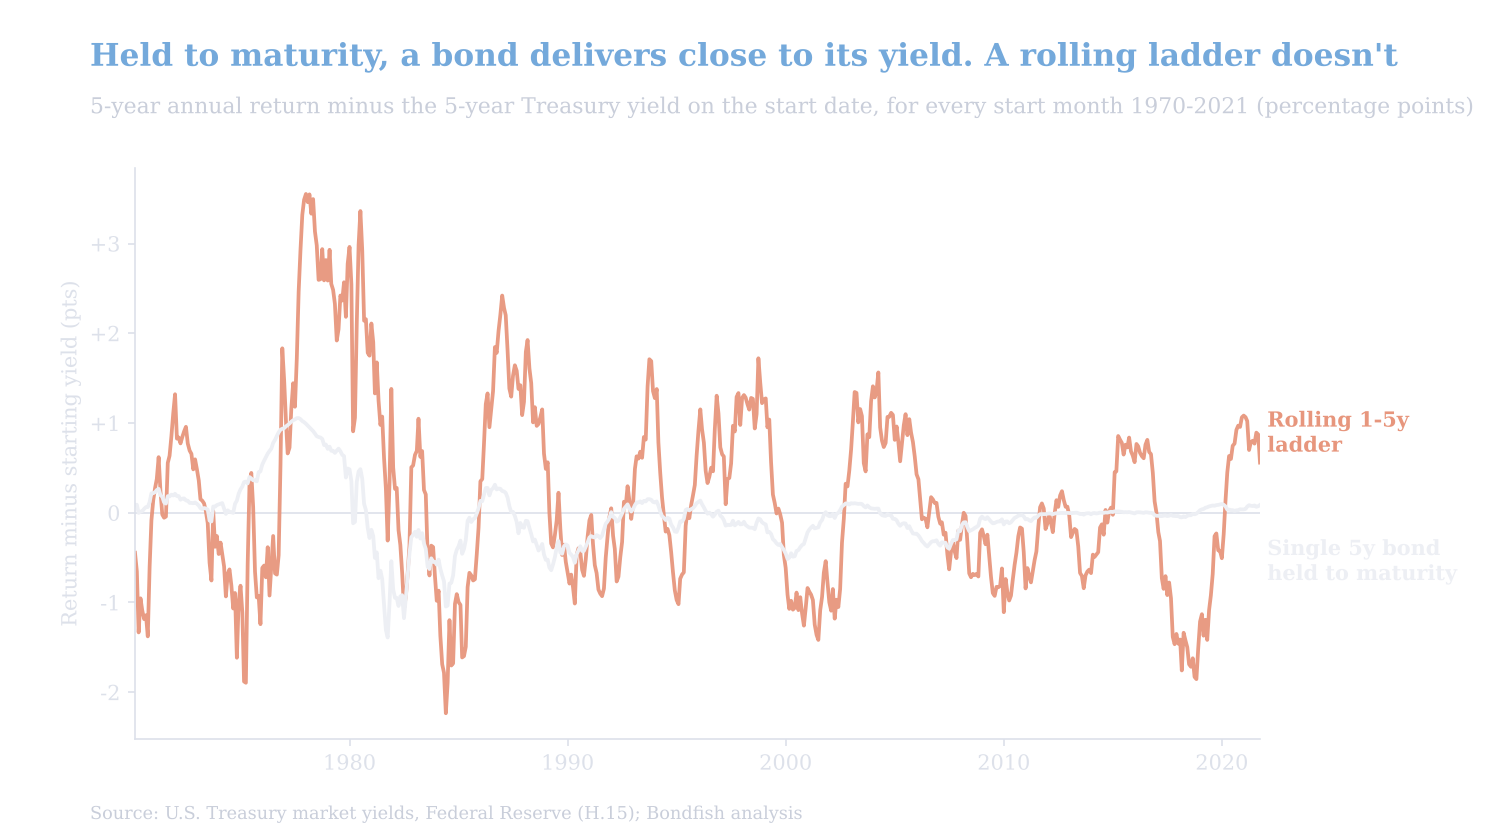
Annual return over each 5-year period minus the 5-year Treasury yield at the start, for start months from February 1970 to September 2021. Source: U.S. Treasury market yields, Federal Reserve (H.15); Bondfish analysis.
A rolling ladder gives up that certainty the moment it reinvests a maturing rung, which makes it a fund you run yourself. The certainty belongs to the spend-down ladder: if you need a set amount in 2028, 2029 and 2030, for tuition or the first years of retirement, bonds maturing in those years deliver it whatever happens to rates in between. Target-maturity ETFs do the same with many bonds per rung.
Outside the U.S., the same logic applies to German Bunds or Italian BTPs. Buying U.S. Treasuries with euros adds currency risk, which can easily outweigh any difference between a ladder and a fund.
A rolling bond ladder and a bond fund with the same maturities are the same investment in different packaging: over 56 years of U.S. Treasury data they returned 5.83% and 5.79% a year, lost money in the same years and fell equally hard when rates rose. The ladder wins only on cost, by roughly the fund’s fee. Choose a ladder, or target-maturity ETFs, when you need known cash on known dates; otherwise a cheap fund does the same job with less work.
Data and method: month-end U.S. Treasury yields on 3-month bills and 1-, 2-, 3-, 5-, 7- and 10-year notes, January 1970 to September 2026, with the shape of the Federal Reserve’s H.15 constant-maturity curve filling the months when the Treasury was not issuing a maturity. Ladder, fund and single-bond returns are Bondfish’s own calculation: par notes repriced every month from the yield curve at their remaining maturity, coupons reinvested. Fund comparisons use the published total-return histories of the iShares 3–7 Year Treasury Bond ETF (IEI) and the iShares iBonds Dec 2025 Term Treasury ETF (IBTF). No fees, trading costs or taxes unless stated. Past performance does not predict future returns.
Every return, drawdown and comparison in this article is Bondfish’s own calculation from public Treasury yield data and fund total-return histories, through September 2026. The underlying data:
This article is for general information only and is not investment advice. Investing involves risk, including possible loss of principal, and past performance does not guarantee future results. Backtested results are hypothetical and do not reflect fees, taxes or trading costs unless stated. Consider your own circumstances or consult a licensed financial professional before investing.