
A rolling down the yield curve strategy paid off in U.S. Treasuries, mostly as payment for extra interest-rate risk. Buying 5-year notes and selling them with 3 years left earned 3.66% a year from October 1996 to September 2026, against 3.17% for holding 5-year notes to maturity, and beat a 2-year note held to maturity in 67% of two-year periods. With today’s flat curve, the built-in head start is 0.34 percentage points a year, against a 30-year average of 0.96.
Ask a bond fund manager where returns come from and you’ll hear two words that rarely reach retail investors: carry and roll. Carry is the yield you collect for owning a bond. Roll, or rolldown, is the price gain a bond picks up simply by getting older, because on a normal yield curve a shorter bond trades at a lower yield. The CFA Institute’s curriculum lists rolling down the yield curve among the standard ways managers try to beat a static portfolio when they expect the curve to stay put.
The idea isn’t new. A 1990 study by Peter Grieves and Alan Marcus for the National Bureau of Economic Research found that riding the Treasury bill curve beat simply holding bills over 1949–1988. It sounds like free money, and in most periods it behaved like it. The catch: the gain only arrives if yields don’t rise by more than the curve’s slope. So we tested the textbook version in Treasury notes, month by month, over the past 30 years.
The yield curve plots Treasury yields against time to maturity. Most of the time it slopes upward, because investors want a little more yield to lend for five years than for three. That slope is what a rolling down the yield curve strategy harvests.
Take the end of 2009, when the curve was unusually steep. A new 5-year Treasury note paid 2.68% and the 3-year yielded 1.68%. Buy the 5-year, wait two years, and it becomes a 3-year note. If the curve hasn’t moved, the market prices it at the 3-year’s 1.68% yield, so a note paying 2.68% is worth about 102.92 per 100 of face value. You’ve collected two years of coupons and a price gain of about 2.9% on top.
The strategy’s return comes from three places:
The investor then sells with three years left, before the note reaches the flatter, lower-yielding short end, and buys a new 5-year. A buy-and-hold investor keeps the note to maturity instead and earns its original yield, no more and no less.
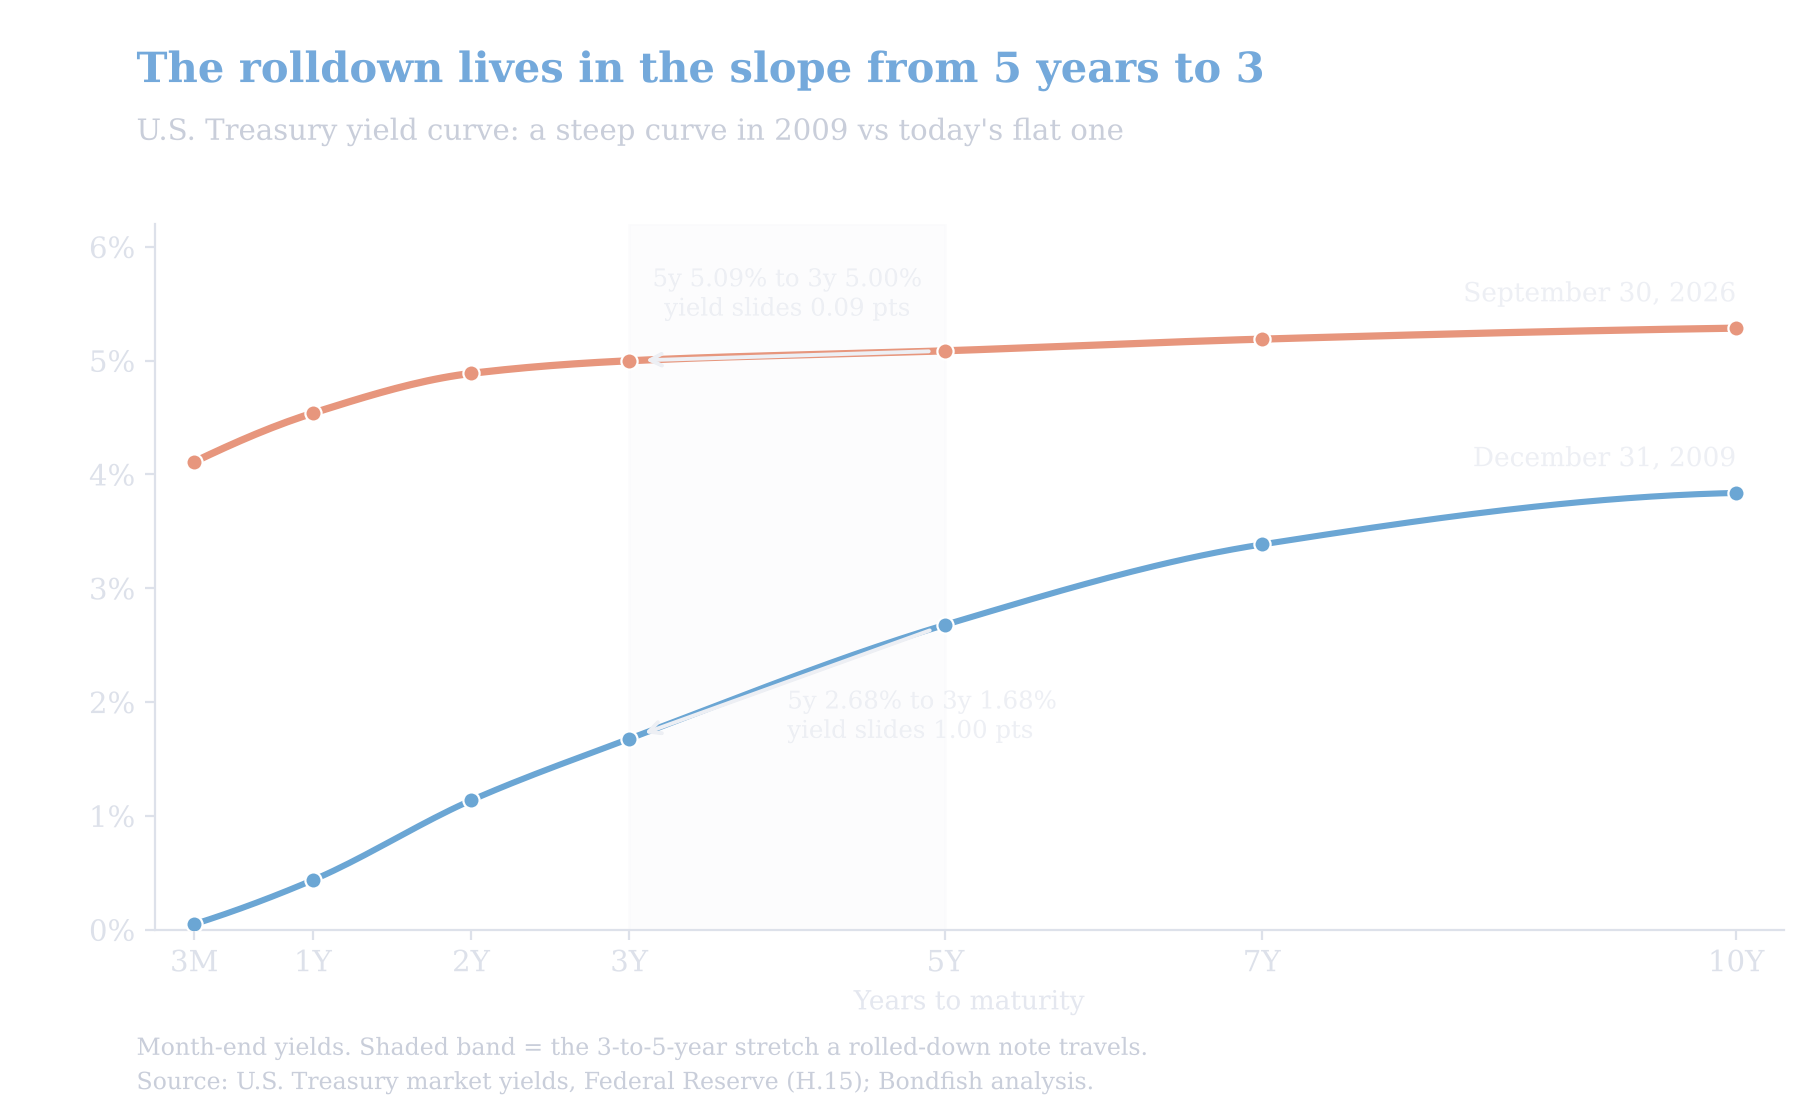
U.S. Treasury yield curve at month-end, December 2009 vs September 2026. The shaded band is the 3-to-5-year stretch a rolled-down note travels. Source: U.S. Treasury market yields, Federal Reserve (H.15); Bondfish analysis.
Today’s curve looks very different. On September 30, 2026, the slide from five years to three was just 0.09 percentage points. We come back to what that means below.
As a check on the method, a portfolio built the same way from 1- to 3-year notes tracked a published 1–3 year U.S. Treasury index with a quarterly correlation of 0.997, and its annual return was within 0.12 percentage points of the index over the full 30 years.
| Strategy | Annual return | $100 became | Worst year | Worst drop |
|---|---|---|---|---|
| Roll down: buy 5-year, sell at 3 | 3.66% | $293 | −10.3% | −11.5% |
| Hold 5-year notes to maturity | 3.17% | $255 | −6.1% | −6.6% |
| 3-month T-bills | 2.31% | $198 | 0.0% | 0.0% |
U.S. Treasuries, October 1996 to September 2026, total return before costs and taxes. Worst year = worst 12 months in a row; worst drop = largest fall from a previous high.
Rolling down earned 0.49 percentage points a year more than holding to maturity. Compounded over 30 years, $100 grew to $293 instead of $255, and rolling down came out ahead in 19 of 29 full calendar years. Both easily beat T-bills.
The last two columns show the price. A rolled-down portfolio always holds notes with 3 to 5 years left, about four years on average. The hold-to-maturity portfolio averages two and a half, because each note spends its final years as a short-term bond. Longer notes carry more duration, the sensitivity of a bond’s price to changes in yields. So when yields jumped in 2022, rolling down lost 8.2% for the year against 4.6% for holding to maturity. Its peak-to-trough fall reached 11.5%, and it didn’t regain its old high until June 2025.
Per unit of risk, the two approaches came out almost level. Measured by the Sharpe ratio, the return above T-bills divided by volatility, rolling down scored 0.39 and holding to maturity 0.41. The extra return was real, but most of it was the market’s normal pay for holding longer bonds.
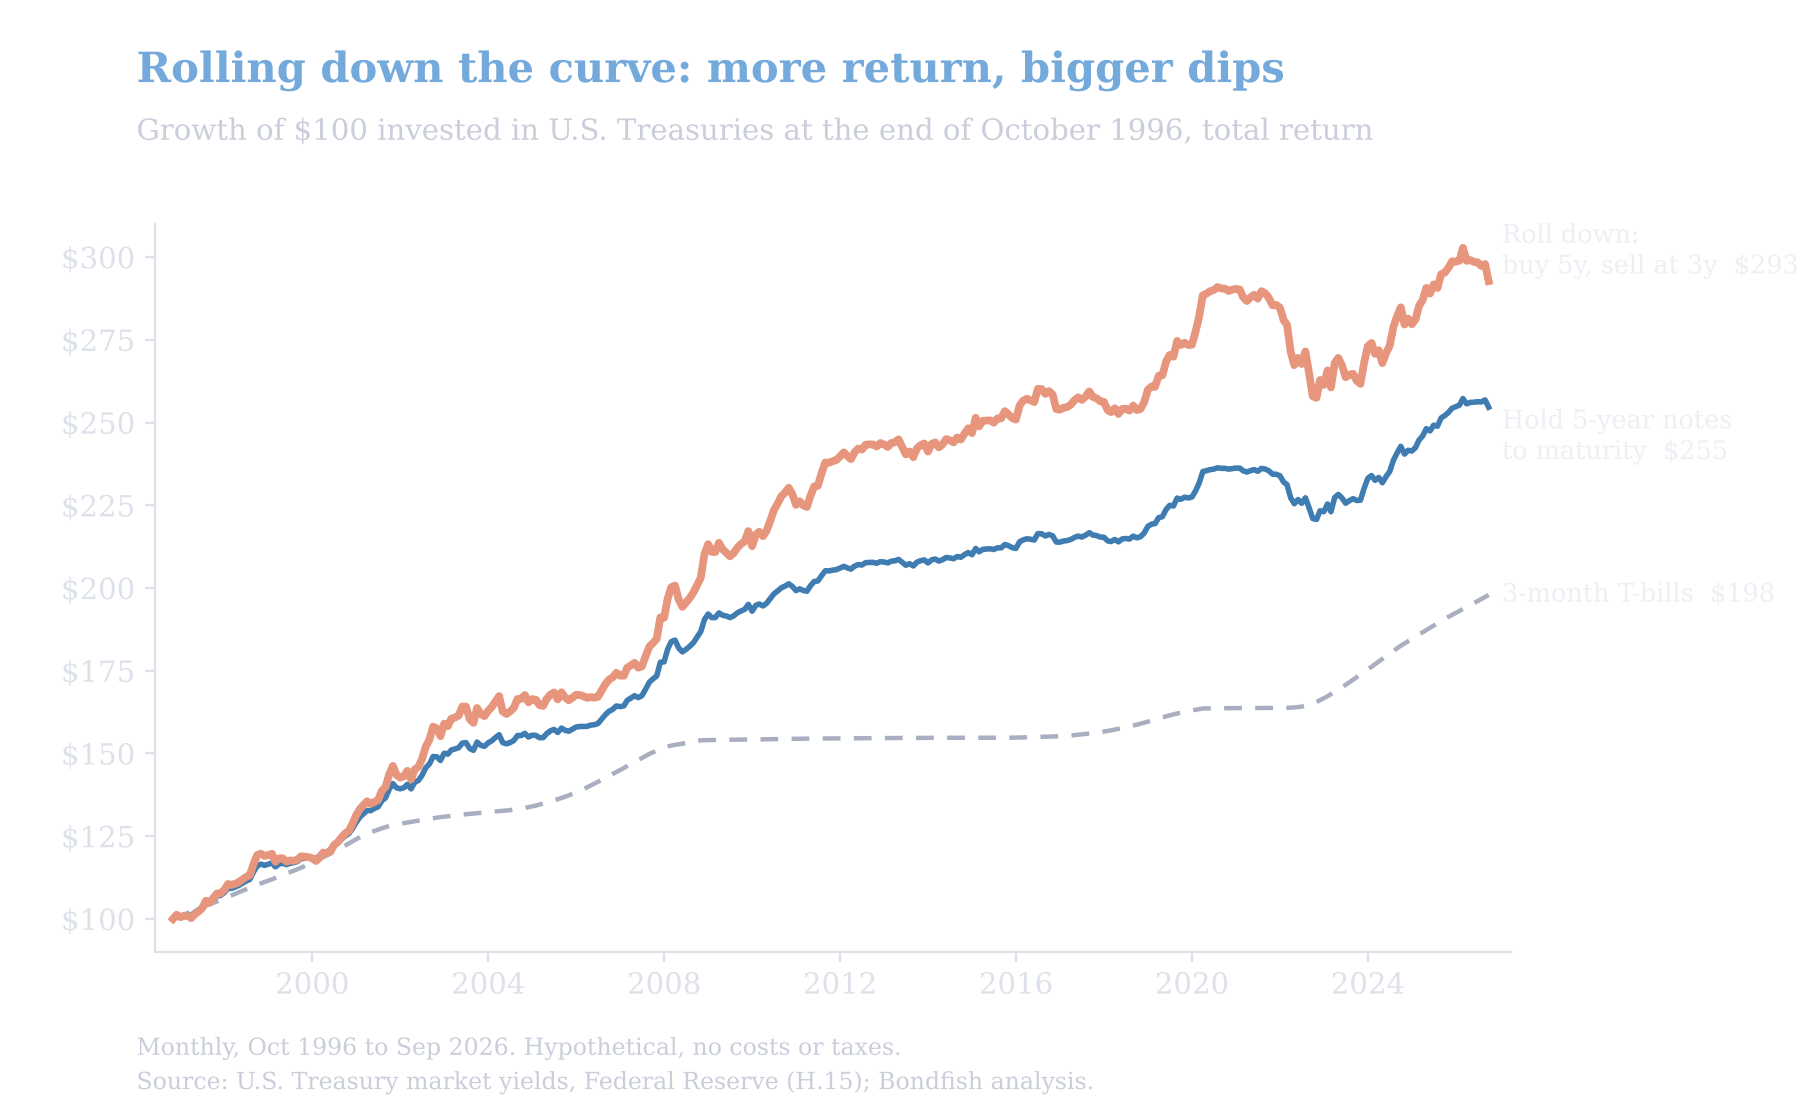
Growth of $100 in U.S. Treasuries, October 1996 to September 2026, total return before costs and taxes. Source: U.S. Treasury market yields, Federal Reserve (H.15); Bondfish analysis.
Professionals usually frame rolldown as a choice for a fixed horizon. Say you have money to park for two years. You can buy a 2-year note and hold it to maturity, which locks in its yield. Or you can buy a 5-year note and sell it after two years, betting that yields won’t rise enough to erase the 5-year’s higher coupon and the rolldown.
We ran that choice for every month from October 1996 to September 2024, 336 starting points in all, the last one sold in September 2026:
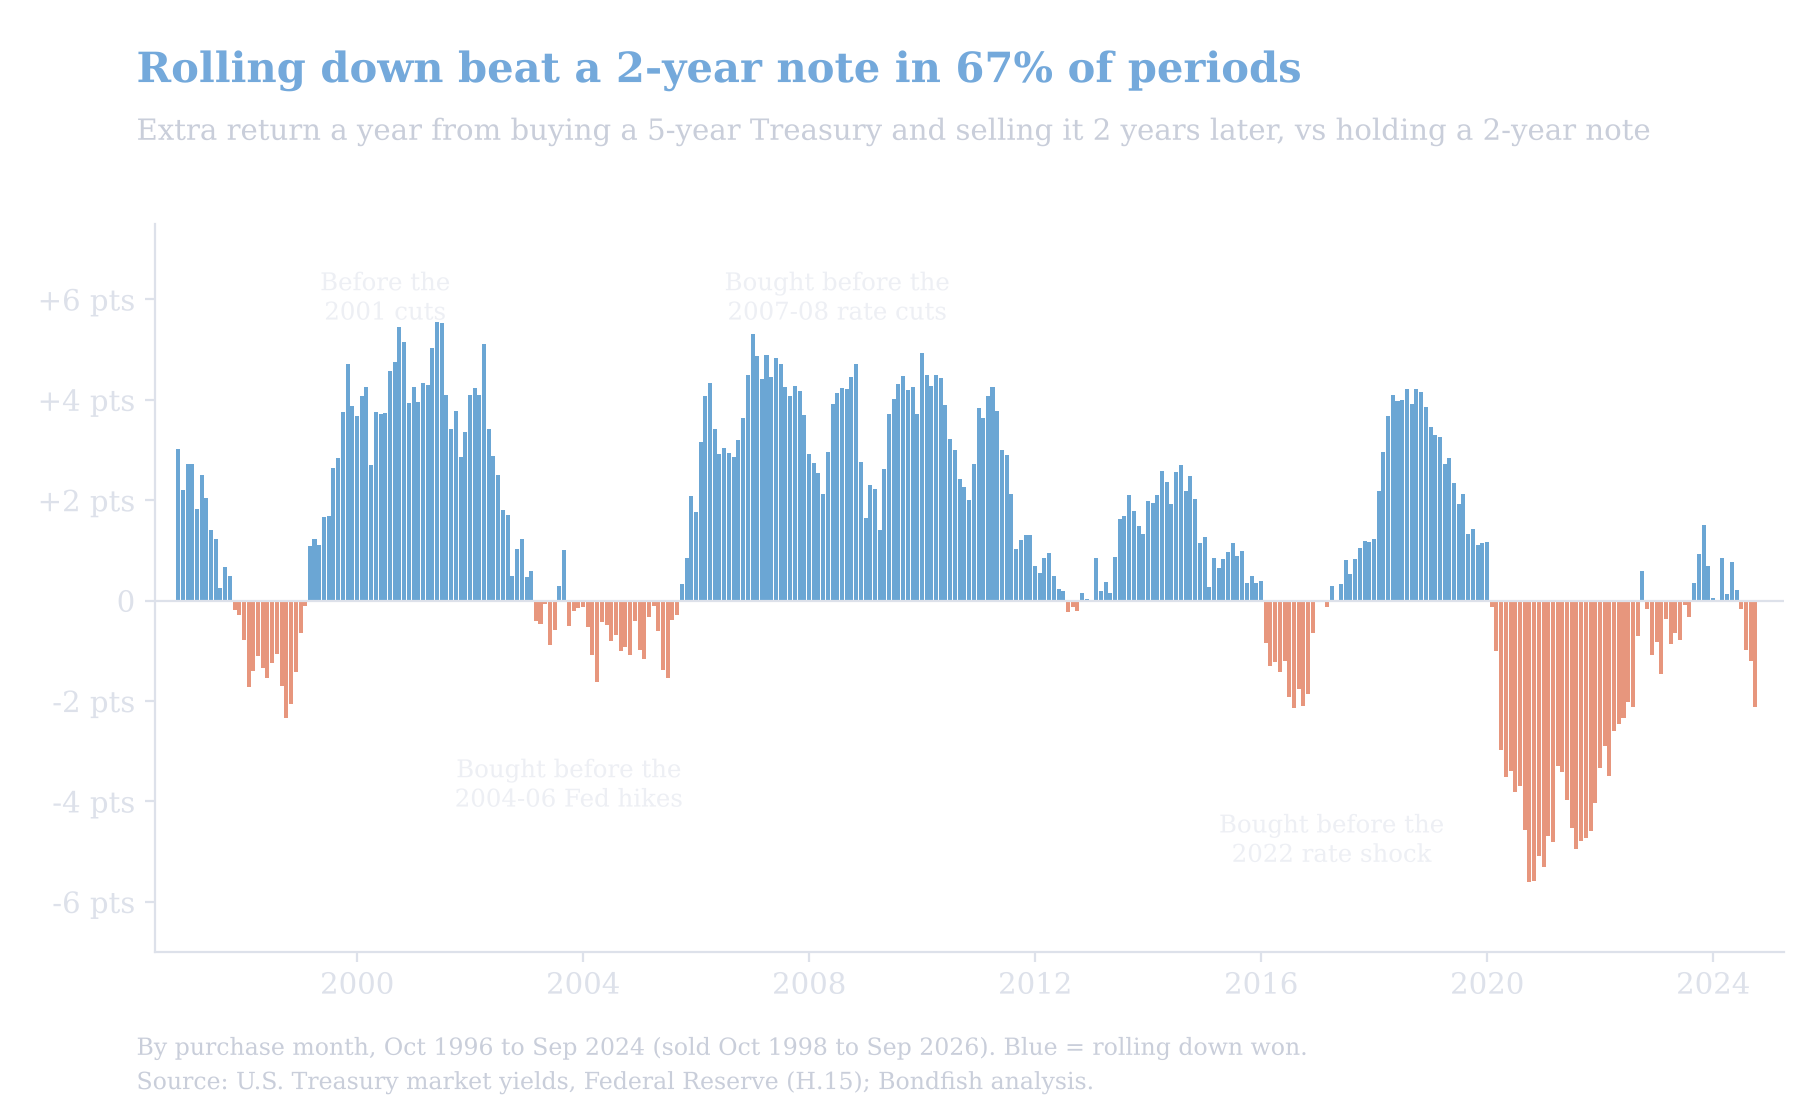
Extra annual return from buying a 5-year note and selling it after two years vs holding a 2-year note to maturity, by purchase month, October 1996 to September 2024. Source: U.S. Treasury market yields, Federal Reserve (H.15); Bondfish analysis.
The 2009 example shows the upside. The 5-year note bought at the end of that year was set to earn about 4.2% a year if the curve held, against 1.14% on the 2-year. Yields then fell further, the 3-year was at 0.35% when the note was sold, and the trade returned 6.07% a year.
Over a longer horizon the result held up too. Across 300 five-year windows, rolling down beat buying one 5-year note and holding it to maturity 74% of the time, by 0.64 points a year on average.
The curve’s slope tells you the size of your head start. What yields do afterwards decides whether you keep it. Across all 336 periods, the edge expected at purchase had a correlation of just 0.14 with what investors actually got.
The losing streaks in the chart line up with Federal Reserve hiking cycles: purchases in 1997–98 ahead of the 1999–2000 hikes, in 2003–05 as the Fed raised rates from 2004 to 2006, in 2016 ahead of the 2017–18 hikes, and from 2020 to mid-2023 around the 2022–23 hikes.
| Curve at purchase | Periods | Roll down won | Extra return |
|---|---|---|---|
| Inverted (5-year below 2-year) | 66 | 68% | +1.69 pts |
| 0 to 0.5 points | 119 | 57% | +0.55 pts |
| 0.5 to 1 point | 72 | 67% | +0.47 pts |
| More than 1 point | 79 | 81% | +2.22 pts |
Buy a 5-year note and sell it after 2 years vs hold a 2-year note to maturity, by how far the 5-year yield sat above the 2-year at purchase. Monthly purchases, October 1996 to September 2024.
A steep curve helped. When the 5-year yielded more than a full percentage point above the 2-year, rolling down won 81% of the time, by 2.22 points a year. An inverted curve, with the 5-year below the 2-year, looks like the worst setup because the rolldown runs backwards. Before 2022 it wasn’t: inversions usually came shortly before Fed rate cuts, and falling yields rescued the trade in 90% of those periods. The 2022–24 inversion broke the pattern because the Fed held rates high, and rolling down won only 37% of the time.
The same two-year trade works from any starting maturity. We compared four versions against the same 2-year note held to maturity:
| Buy, then sell 2 years later | Extra return | Won | Worst case |
|---|---|---|---|
| 3-year note (sold at 1 year) | +0.39 pts | 68% | −2.29 pts |
| 5-year note (sold at 3 years) | +1.15 pts | 67% | −5.61 pts |
| 7-year note (sold at 5 years) | +1.69 pts | 70% | −8.13 pts |
| 10-year note (sold at 8 years) | +1.90 pts | 71% | −11.19 pts |
Buy a Treasury note, sell it 2 years later, vs hold a 2-year note to maturity. Extra return in percentage points a year; worst case = worst of 336 monthly starts, October 1996 to September 2024.
Every version beat the 2-year note on average, and the extra return grew with maturity. So did the risk. The 10-year version’s worst two-year stretch cost 11.19 points a year, about twice the 5-year version’s worst. The 3-year version, sold with one year left, earned a modest 0.39 points but never lagged by more than 2.29.
On September 30, 2026, the U.S. Treasury’s official yield curve put the 2-year note at 4.88%, the 3-year at 5.00% and the 5-year at 5.09%. That leaves very little to roll down. A 5-year note bought that day and sold in two years at an unchanged 3-year yield would fetch about 100.24 per 100, a price gain of 0.24%.
If the curve stays where it is, buying the 5-year and selling it after two years would earn about 0.34 points a year more than the 2-year note. That’s well below the 30-year average of 0.96 points and lower than in 63% of the months we tested. The cushion is thin, too: a rise of about 0.25 percentage points in yields over the two years would erase it.
The Federal Reserve raised its target range by a quarter point to 3.75%–4.00% on September 16, 2026, its first increase since 2023, and said inflation “remains elevated.” Nobody knows where yields go next. The backtest only says that when they rose over a two-year hold, rolling down won 37% of the time.
Rolling down the yield curve is how professionals squeeze extra return out of a sloping curve, and in 30 years of U.S. Treasury data it worked: 3.66% a year against 3.17% for holding 5-year notes to maturity, and a win over a 2-year note in 67% of two-year periods. The edge came with more interest-rate risk, it shrank to nothing per unit of that risk, and it turned into losses whenever yields rose faster than the curve’s slope. Today’s flat stretch between three and five years offers a head start of about 0.34 points a year, well below the long-run average, with the Fed raising rates again.
Data and method: month-end U.S. Treasury yields on 3-month bills and 1-, 2-, 3-, 5-, 7- and 10-year notes, October 1996 to September 2026, with Federal Reserve H.15 constant-maturity yields filling the months when the Treasury was not issuing a maturity. Note returns are Bondfish’s own calculation: par notes repriced every month from the yield curve at their remaining maturity, with coupons reinvested. Full-period strategy results average equal slices started in every month of the cycle. No fees, trading costs or taxes. Past performance does not predict future returns.
Every return, win rate and strategy result in this article is Bondfish’s own calculation from public Treasury yield data, through September 2026. The underlying data:
This article is for general information only and is not investment advice. Investing involves risk, including possible loss of principal, and past performance does not guarantee future results. Backtested strategy results are hypothetical and do not reflect fees, taxes or trading costs. Consider your own circumstances or consult a licensed financial professional before investing.