

A bond tent glidepath works as insurance for the first years of retirement, not as a better strategy overall. In U.S. data back to 1871, cutting stocks to 30% at retirement and rebuilding to 60% over the next decade ran out of money in 3.7% of 30-year retirements at a 4% withdrawal rate, against 2.8% for a plain 60/40 and 11.9% for de-risking and staying there.
Few retirement ideas travel faster in early-retirement forums than the bond tent. The logic is intuitive: the years just before and just after you stop working are when a market crash does the most damage, because your portfolio is at its largest and you are about to start selling it to live on. So you load up on bonds going into retirement, spend those bonds first, and let your stock allocation climb back.
Financial planner Michael Kitces popularized the term, and a 2014 study by Wade Pfau and Kitces in the Journal of Financial Planning found that a rising equity glidepath (30% stocks at retirement, climbing to 60%) beat a constant 60% in Monte Carlo simulations. We wanted to know what actually happened. So we ran the strategy through every U.S. retirement start date from 1881 to 1996.
A glidepath is a schedule for how your stock-bond mix changes over time. Most target-date funds use a declining glidepath: fewer stocks every year, all the way through retirement. A bond tent is different. The bond share rises into retirement and then falls again, so on a chart the bond allocation looks like a tent, an upside-down V.
It is built to fight sequence-of-returns risk: the danger that bad returns arrive early in retirement, while you are withdrawing, so you sell assets at low prices and never catch up. Kitces calls the final decade before retirement and the early years after it the retirement red zone.
We compared three paths, each starting 10 years before retirement:
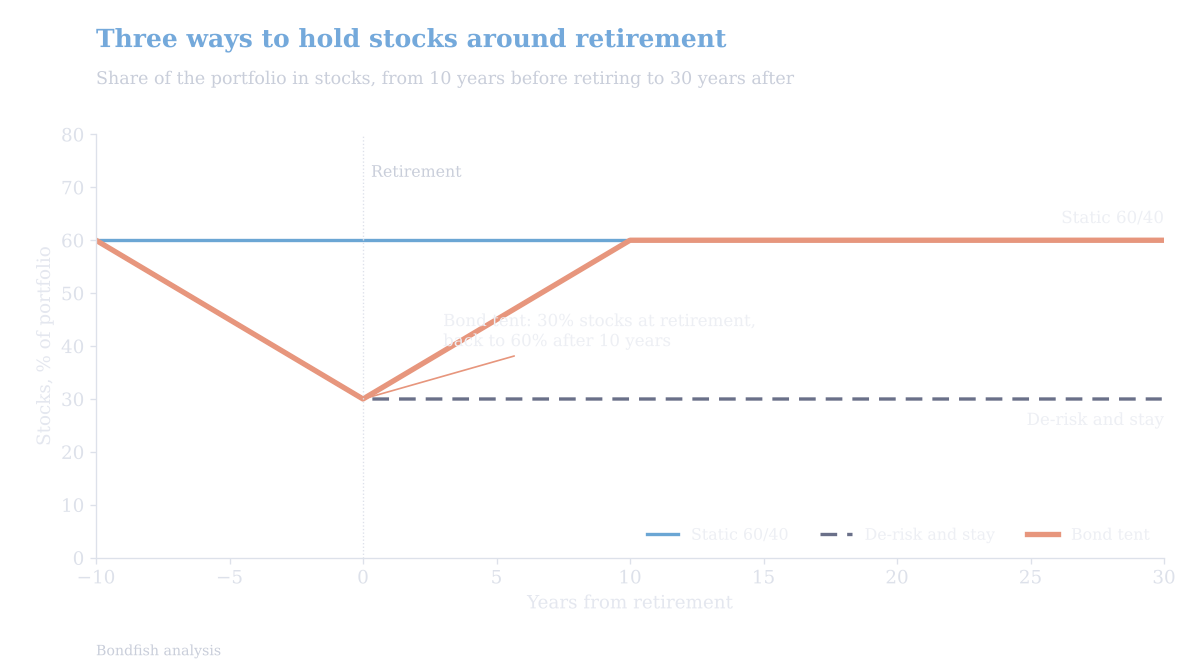
Stock allocation from 10 years before retirement to 30 years after, for the three paths we tested. Source: Bondfish analysis.
Two caveats. Before 1989 the stock data are monthly averages and the bond yields before 1953 are smoothed annual figures, which makes the early record look a little calmer than it was. And the data are American because they are the longest continuous record; the logic carries over to other markets, but the exact numbers will not.
| Strategy | Fails at 4% | Fails at 4.5% | Fails at 5% | Worst case |
|---|---|---|---|---|
| Static 60/40 | 2.8% | 11.8% | 26.1% | 3.76% |
| Bond tent (60→30→60) | 3.7% | 14.5% | 33.1% | 3.70% |
| De-risk and stay (30/70) | 11.9% | 36.6% | 50.9% | 3.54% |
Share of 1,389 U.S. retirements (monthly start dates, 1881 to 1996) that ran out of money within 30 years. Worst case = highest withdrawal rate that survived every start date.
At every withdrawal rate we tested, the tent ran out of money slightly more often than a plain 60/40, and its worst-case safe withdrawal rate was a touch lower: 3.70% against 3.76%, both for retirements that began in the mid-1960s. Across all start dates, the tent’s safe withdrawal rate was below the 60/40’s 78% of the time.
What the tent clearly beat was the path many investors actually drift into: de-risking and staying conservative. The 30/70 portfolio failed more than three times as often as the tent at 4% (11.9% vs 3.7%) and two and a half times as often at 4.5% (36.6% vs 14.5%). The useful half of the tent is not the bonds going in. It is the stocks coming back.
That part matches Pfau and Kitces, who also found that declining glidepaths do not help. Where history departs from their simulations is the head-to-head with a constant 60%: their slower version, rising from 30% to 60% over the full 30 years, did worse still in our data, failing 5.7% of the time at 4%.
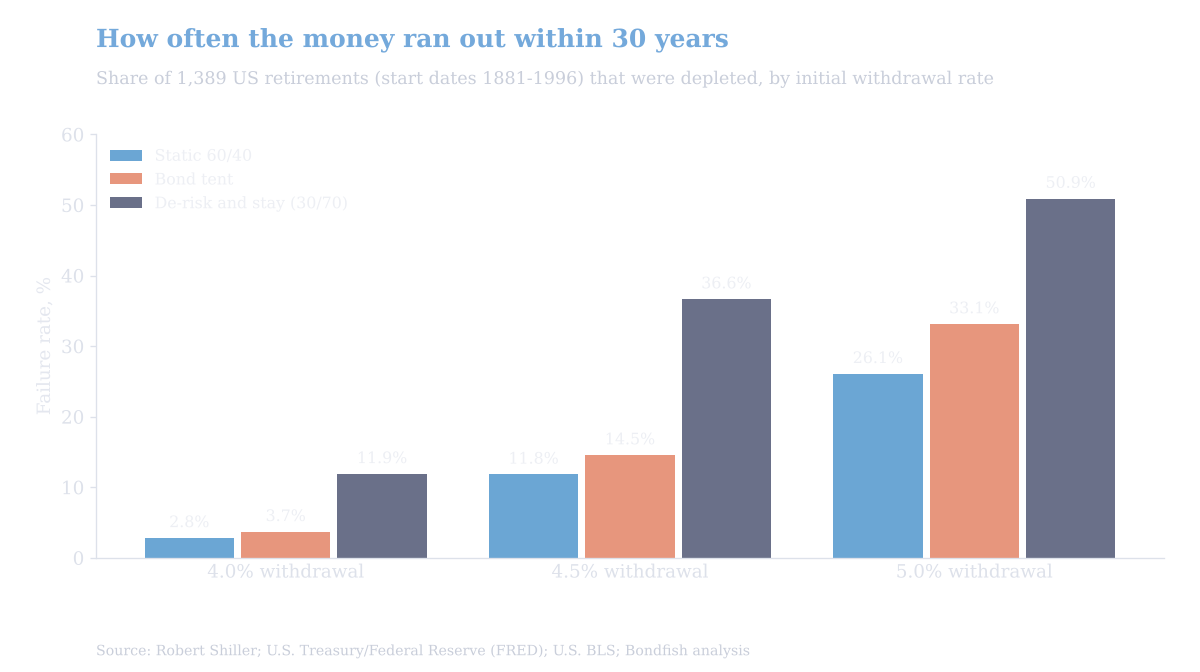
Share of 1,389 U.S. retirements (monthly start dates, 1881 to 1996) that ran out of money within 30 years. Source: Robert Shiller (S&P 500, early yields and prices), U.S. Treasury / Federal Reserve (yields), U.S. Bureau of Labor Statistics (CPI); Bondfish analysis.
Notice also how much more the withdrawal rate matters than the glidepath. For the same 60/40 portfolio, moving from a 4% to a 5% withdrawal lifted the failure rate from 2.8% to 26.1%.
The tent earns its keep in one specific scenario: a deep bear market in the first few years of retirement, followed by a recovery. Holding more bonds at the bottom means selling fewer stocks cheaply, and the rebuild to 60% puts money back into stocks while they are still cheap. The tent’s wins cluster around 1929–1931, 1937 and 1968–1973.
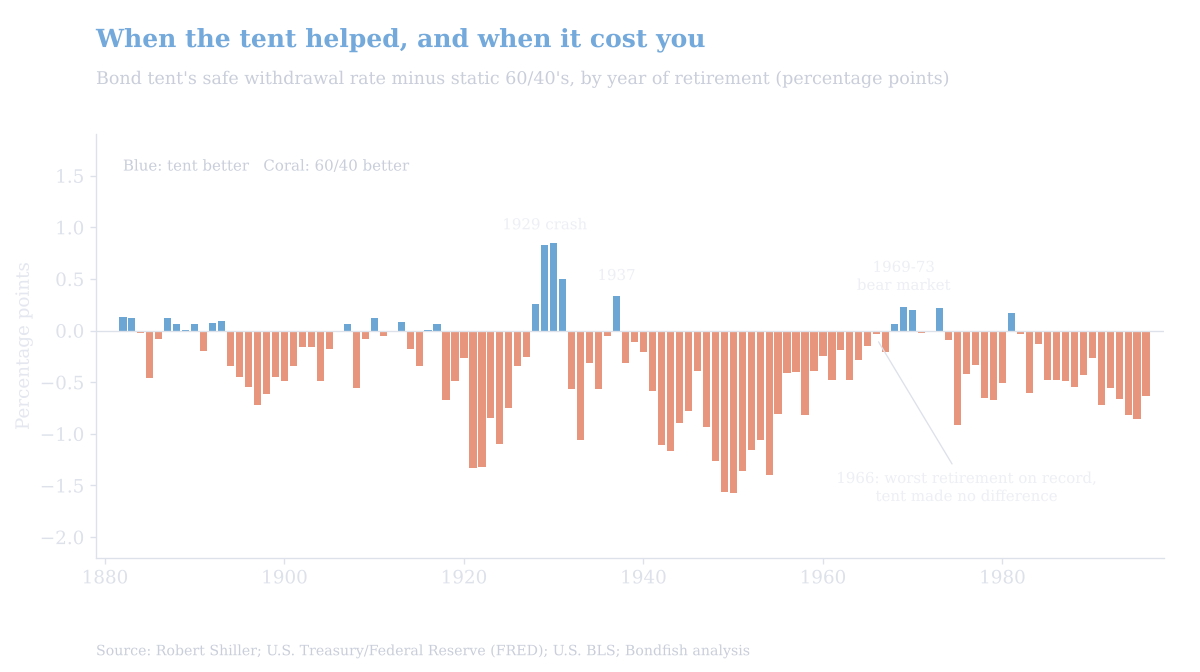
Bond tent safe withdrawal rate minus static 60/40 safe withdrawal rate, January start dates 1881 to 1996, percentage points. Source: Robert Shiller (S&P 500, early yields and prices), U.S. Treasury / Federal Reserve (yields), U.S. Bureau of Labor Statistics (CPI); Bondfish analysis.
| Retired in | 60/40 | Bond tent | De-risk & stay |
|---|---|---|---|
| October 1929 | 23 | 124 | 37 |
| March 1937 | 33 | 67 | Ran out, year 28 |
| January 1966 | Ran out, year 27 | Ran out, year 26 | Ran out, year 25 |
| January 1973 | 31 | 53 | 17 |
| January 2000 (still running) | 56 | 104 | 52 |
| January 2008 (still running) | 124 | 136 | 70 |
Real portfolio value after 30 years (or at September 2026 for retirements still running), 4% initial withdrawal raised with inflation. Balance on retirement day = 100.
The 2000 retiree is the modern example. A 60/40 retiree withdrawing 4% hit the dot-com bust and then 2008 in the first decade, and by September 2026 was down to 56% of the starting balance in real terms. The tent retiree had rebuilt to 104%. The catch: de-risking through the late-1990s boom would have left the tent investor with about 19% less money on retirement day, so the tent bought that safety with a smaller nest egg.
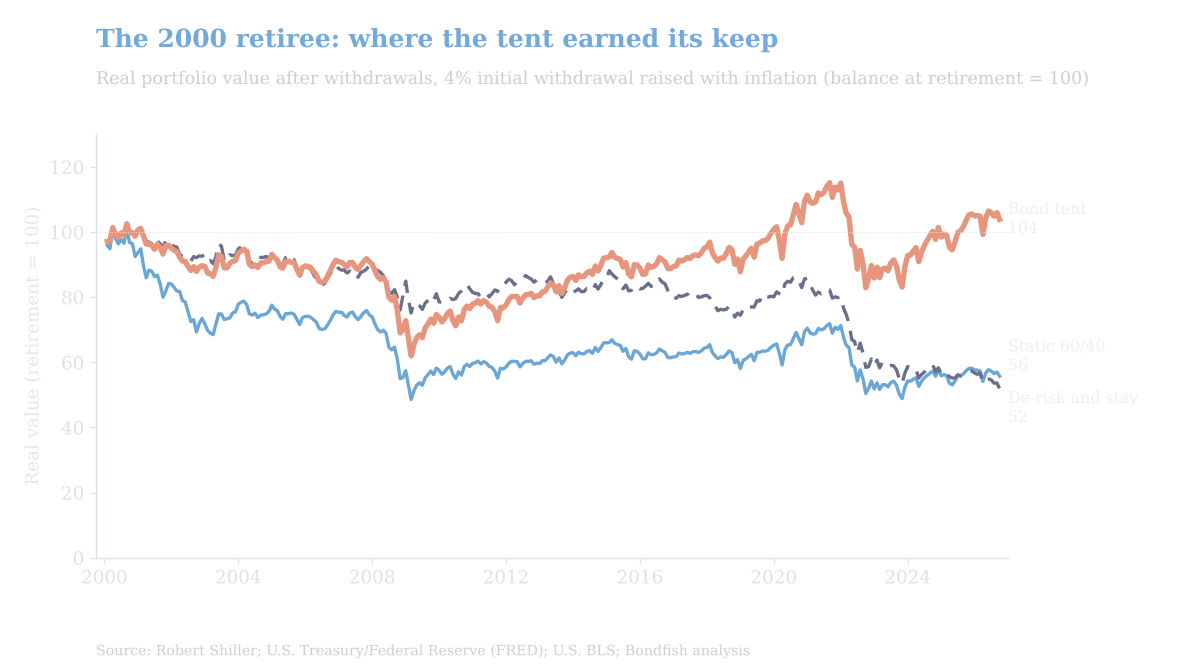
Real portfolio value for a January 2000 retiree, 4% initial withdrawal raised with inflation, through September 2026. Source: Robert Shiller (S&P 500, early yields and prices), U.S. Treasury / Federal Reserve (yields), U.S. Bureau of Labor Statistics (CPI); Bondfish analysis.
The tent’s first half has a price that failure rates don’t show. Cutting stocks from 60% to 30% over the 10 years before retirement left the typical retiree about 5% poorer in real terms on retirement day, and it came out ahead of 60/40 in only 18% of start dates, mostly right after crashes. Someone retiring in July 1932 who had de-risked through the crash had 32% more money than a 60/40 investor.
Counting both halves together, the worst start date in history still supported inflation-adjusted spending of $55,000 a year for every $1 million held 10 years before retiring with 60/40, $53,800 with the tent and $42,500 with de-risk-and-stay.
The worst start dates in U.S. history for a 60/40 retiree came in the mid-1960s, and the tent made no difference. The 1966 retiree’s problem was not one crash but 16 years of inflation. U.S. consumer prices nearly tripled between 1966 and 1981, and the 10-year Treasury yield climbed from 4.65% at the end of 1965 to 15.84% in September 1981. Over 1966–1981 our 10-year Treasury series lost 2.95% a year after inflation, worse than stocks at -0.97% a year.
A tent made of long bonds simply moved money from one losing asset to another. At 4%, the 1966 60/40 retiree ran out after 26 years and 4 months, the tent retiree after 25 years and 10 months, and the de-risk-and-stay retiree after 24 years. That is the biggest gap in the bond tent story: it insures against a crash, not against inflation, which is why how bonds react to inflation matters as much as how many of them you hold.
We reran the test with shorter, less inflation-sensitive bonds replacing the 10-year Treasury in every portfolio. The data start later, so these windows are shorter; treat them as supporting evidence rather than a verdict.
In both cases the tent did what it promises. Shorter bonds lose less when yields jump, which is the core idea behind bond duration versus maturity, so they make better tent material than long bonds.
The material history points to, short and inflation-protected, is unusually cheap right now. On September 30, 2026, the 10-year Treasury Inflation-Protected Securities (TIPS) real yield was 2.93% and the 5-year was 2.73%, according to U.S. Treasury data. As recently as 2021, the 10-year real yield was below -1%.
TIPS cannot be backtested over a long history because the first ones were issued in 1997, so this part is an inference rather than a test result. But a ladder of TIPS maturing over the first 10 years of retirement does the tent’s job: it funds the early withdrawals, it is protected against the 1966-style inflation that broke long bonds, and today it locks in a real return near 3% a year. A bond ladder calculator is a practical way to plan the rungs, and you can screen government bonds by maturity and yield on Bondfish. Investors outside the U.S. can use inflation-linked government bonds in their own currency for the same role.
A bond tent glidepath is crash insurance for the first decade of retirement. In U.S. history it paid out when a bear market hit right after the retirement date and cost a little in most other periods, leaving it slightly behind a plain 60/40 on failure rates. Its real value is forcing retirees to rebuild their stock allocation instead of drifting into a permanently conservative portfolio, and real yields near 3% make inflation-protected tent material unusually attractive today.
Data and method: U.S. stocks are the S&P 500 total return (Robert Shiller’s monthly-average data to 1989, month-end index levels after); the bond leg is Bondfish’s own calculation for a constant-maturity 10-year U.S. Treasury, repriced monthly from 10-year yields (Robert Shiller to 1961, U.S. Treasury / Federal Reserve from 1962). Inflation is U.S. CPI (Robert Shiller to 1912, U.S. Bureau of Labor Statistics after). Retirements start every month from 1881 to 1996 and last 30 years; withdrawals rise with inflation each month; portfolios rebalance monthly. No fees, trading costs or taxes. Past performance does not predict future returns.
Every failure rate, safe withdrawal rate and portfolio value in this article is Bondfish’s own calculation from public market data, through September 2026. The underlying data:
This article is for general information only and is not investment advice. Investing involves risk, including possible loss of principal, and past performance does not guarantee future results. Backtested portfolio results are hypothetical and do not reflect fees, taxes or trading costs. Consider your own circumstances or consult a licensed financial professional before investing.